 Global| Feb 15 2008
U.S. Import Price Rise Strong
by:Tom Moeller
|in:Economy in Brief
Summary
Overall import prices during January rose a strong 1.7%. The rise, which was three times expectations, followed the December respite when temporarily lower oil prices produced a revised 0.2% decline initially reported as no change. [...]
Overall import prices during January rose a strong 1.7%. The rise, which was three times expectations, followed the December respite when temporarily lower oil prices produced a revised 0.2% decline initially reported as no change. Consensus expectations had been for a 0.5% rise in January prices.
Petroleum prices jumped 5.5% after a 1.9% decline to close out last year. Crude petroleum prices surged 4.5% (69.7% y/y) after December's 1.3% decline. That strength was exceeded by a 10.2% (73.7% y/y) jump in fuel oil prices and an 8.1% (44.2% y/y) rise in other petroleum product prices.
Less petroleum, import prices rose 0.6% after a 0.3% December increase. The latest m/m rise was near the strongest since November 2006. During the last ten years there has been a 66% (negative) correlation between the nominal trade-weighted exchange value of the US dollar vs. major currencies and the y/y change in non oil import prices. The correlation is a reduced 47% against a broader basket of currencies.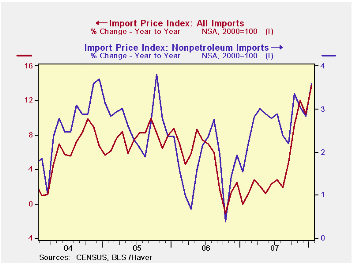
Prices for industrial supplies & materials excluding petroleum surged 2.2% (10.1% y/y) led by strength in paper prices and a 9.7% (21.1% y/y) blowout in chemical prices. The detailed import price series can be found in the Haver USINT database.
Capital goods import prices fell 0.2% (+0.5% y/y) as prices of computers, peripheral and semiconductors declined again, last month by 1.4% (-5.4% y/y). Less the high tech sector, January capital goods prices rose a modest 0.2% (3.0% y/y) though that rate of gain has accelerated from 2.7% growth last year and 1.4% during 2006.
Prices for imports of nonauto consumer goods rose 0.3% (1.6% y/y) and that y/y rise in prices has been stable since early last year. Apparel prices rose 0.3% (1.9% y/y). These prices had been unchanged or declining through 2004 to 2006. Prices for household goods rose 0.4% (1.5% y/y), a y/y change that has been fairly stable.
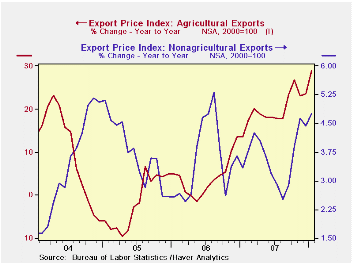
Overall export prices surged 1.2% due to a 5.0% (28.9% y/y) rise in agricultural prices. Prices for nonagricultural goods also rose a relatively strong 0.8% (4.8% y/y).
Some Simple Tests of the Globalization and Inflation Hypothesis from the Federal Reserve Board can be found here.
| Import/Export Prices (NSA) | January | December | Y/Y | 2007 | 2006 | 2005 |
|---|---|---|---|---|---|---|
| Import - All Commodities | 1.7% | -0.2% | 13.7% | 4.2% | 4.9% | 7.5% |
| Petroleum | 5.5% | -1.9% | 66.9% | 11.5% | 20.6% | 37.6% |
| Non-petroleum | 0.6% | 0.3% | 3.6% | 2.7% | 1.7% | 2.7% |
| Export- All Commodities | 1.2% | 0.4% | 6.7% | 4.9% | 3.6% | 3.2% |

Tom Moeller
AuthorMore in Author Profile »Prior to joining Haver Analytics in 2000, Mr. Moeller worked as the Economist at Chancellor Capital Management from 1985 to 1999. There, he developed comprehensive economic forecasts and interpreted economic data for equity and fixed income portfolio managers. Also at Chancellor, Mr. Moeller worked as an equity analyst and was responsible for researching and rating companies in the economically sensitive automobile and housing industries for investment in Chancellor’s equity portfolio. Prior to joining Chancellor, Mr. Moeller was an Economist at Citibank from 1979 to 1984. He also analyzed pricing behavior in the metals industry for the Council on Wage and Price Stability in Washington, D.C. In 1999, Mr. Moeller received the award for most accurate forecast from the Forecasters' Club of New York. From 1990 to 1992 he was President of the New York Association for Business Economists. Mr. Moeller earned an M.B.A. in Finance from Fordham University, where he graduated in 1987. He holds a Bachelor of Arts in Economics from George Washington University.
More Economy in Brief


