 Global| Jun 18 2013
U.S. Housing Starts Rise As Multi-family Recovers
by:Tom Moeller
|in:Economy in Brief
Summary
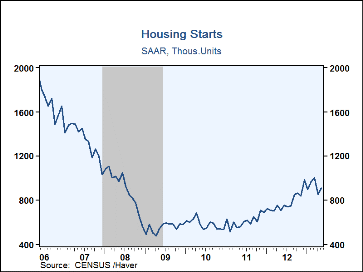
Housing starts recovered last month following a sharp April decline. There has been no growth, however, during the last several months. Total housing starts increased 6.8% (28.6% y/y) during May to 914,000 (AR) from 856,000 in April, [...]
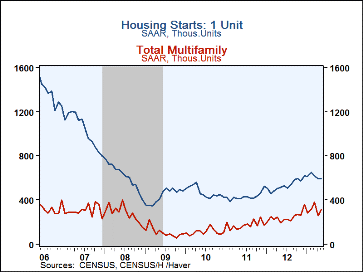
Housing starts recovered last month following a sharp April decline. There has been no growth, however, during the last several months. Total housing starts increased 6.8% (28.6% y/y) during May to 914,000 (AR) from 856,000 in April, initially reported as 853,000 mil. Expectations had been for 950,000 starts in the Action Economics survey. Starts of multi-family units recovered 21.6% (60.7% y/y) to 315,000 and made up half of April's drop. Starts of single-family homes, however, ticked just 0.3% higher (16.3% y/y) to 599,000. These starts have been trending sideways since last fall.
By region, higher starts in the South led last month's recovery with a 17.8% increase (33.5% y/y) to 490,000. Starts in the West also rebounded 5.7% (39.0% y/y) to 221,000 and made up all of April's drop. Working the other way, housing starts in the Northeast fell 9.0% (-9.0% y/y), the fourth monthly decline this year. Starts were down 38.3% from the December peak. In the Midwest, housing starts fell 13.7% last month (+23.4% y/y) to 132,000.
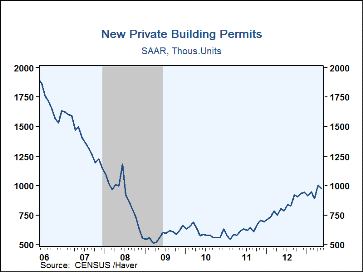
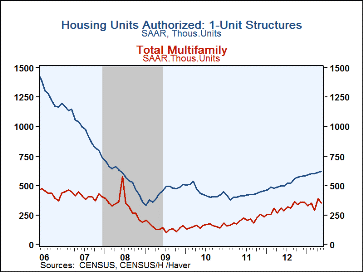
Building permits backpedaled 3.1% (+20.8% y/y) to 974,000 last month following a 12.9% April jump. Permits to build single-family homes gained 1.3% (24.6% y/y) to 622,000, the high for the economic recovery. Permits to build multi-family units fell 10.0% (+14.7% y/y) to 352,000.
The housing starts figures can be found in Haver's USECON database. The expectations figure is contained in the AS1REPNA database.
| Housing Starts (000s, SAAR) | May | Apr | Mar | May Y/Y% | 2012 | 2011 | 2010 |
|---|---|---|---|---|---|---|---|
| Total | 914 | 856 | 1,005 | 28.6 | 781 | 612 | 586 |
| Single-Family | 599 | 597 | 623 | 16.3 | 534 | 434 | 471 |
| Multi-Family | 315 | 259 | 382 | 60.7 | 247 | 178 | 114 |
| Starts By Region | |||||||
| Northeast | 71 | 78 | 94 | -9.0 | 78 | 68 | 72 |
| Midwest | 132 | 153 | 140 | 23.4 | 129 | 103 | 97 |
| South | 490 | 416 | 554 | 33.5 | 400 | 309 | 296 |
| West | 221 | 209 | 217 | 39.0 | 173 | 132 | 120 |
| Building Permits | 974 | 1,005 | 890 | 20.8 | 800 | 624 | 604 |
Tom Moeller
AuthorMore in Author Profile »Prior to joining Haver Analytics in 2000, Mr. Moeller worked as the Economist at Chancellor Capital Management from 1985 to 1999. There, he developed comprehensive economic forecasts and interpreted economic data for equity and fixed income portfolio managers. Also at Chancellor, Mr. Moeller worked as an equity analyst and was responsible for researching and rating companies in the economically sensitive automobile and housing industries for investment in Chancellor’s equity portfolio. Prior to joining Chancellor, Mr. Moeller was an Economist at Citibank from 1979 to 1984. He also analyzed pricing behavior in the metals industry for the Council on Wage and Price Stability in Washington, D.C. In 1999, Mr. Moeller received the award for most accurate forecast from the Forecasters' Club of New York. From 1990 to 1992 he was President of the New York Association for Business Economists. Mr. Moeller earned an M.B.A. in Finance from Fordham University, where he graduated in 1987. He holds a Bachelor of Arts in Economics from George Washington University.
More Economy in Brief
 Global| Feb 05 2026
Charts of the Week: Balanced Policy, Resilient Data and AI Narratives
by:Andrew Cates


