Global| Oct 20 2015
U.S. Housing Starts Post Firm Gain but Building Permits Ease
by:Tom Moeller
|in:Economy in Brief
Summary
Housing starts during September increased 6.0% to 1.206 million (AR) from 1.132 million in August, last month reported as 1.126 million. During all of the third quarter, starts inched 0.5% higher versus Q2. The latest figure surpassed [...]


Housing starts during September increased 6.0% to 1.206 million (AR) from 1.132 million in August, last month reported as 1.126 million. During all of the third quarter, starts inched 0.5% higher versus Q2. The latest figure surpassed expectations for 1.131 million starts in the Action Economics Forecast Survey.
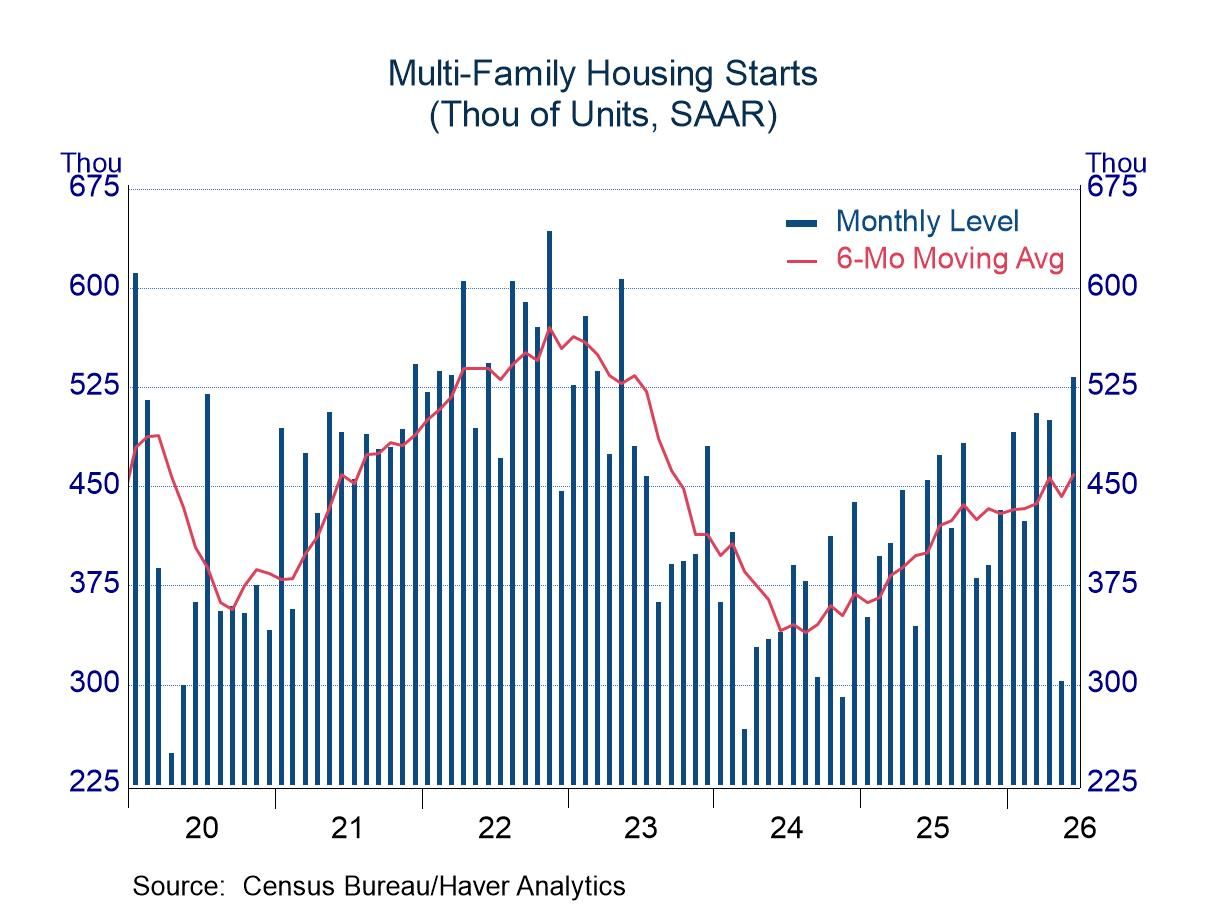
Last month's increase in starts was paced by an 18.3% gain (28.7% y/y) in multi-family units. Strength in multi-family starts has been notable in the Northeast (50.9% y/y), the West (42.1% y/y) and the South (38.6% y/y). Multi-family starts in the Midwest were off 47.2% y/y during September. Starts of single-family units nudged just 0.3% higher but remained up 11.1% y/y. Here again, activity in the Midwest was weak as single-family starts fell 4.4% y/y. That compared to a 20.5% y/y rise in the West, a 14.7% gain in the South and a 4.2% rise in the Northeast.
Permits to build housing units retreated 5.0% (+4.4% y/y) to 1.103 million. They were down 17.5% from a June peak. Weakness was notable in the multi-family sector where permits fell 12.1% (+1.1% y/y). Declines occurred throughout most of the country. Single-family permits also eased 0.3% (+6.6% y/y), reflecting shortfalls in the Northeast and West.
The housing starts figures can be found in Haver's USECON database. The expectations figure is contained in the AS1REPNA database.


| Housing Starts (000s, SAAR) | Sep | Aug | Jul | Sep Y/Y % | 2014 | 2013 | 2012 |
|---|---|---|---|---|---|---|---|
| Total | 1,206 | 1,132 | 1,152 | 17.8 | 1,001 | 928 | 784 |
| Single-Family | 740 | 738 | 759 | 11.1 | 647 | 620 | 537 |
| Multi-Family | 466 | 394 | 393 | 28.7 | 354 | 308 | 247 |
| Starts By Region | |||||||
| Northeast | 137 | 111 | 160 | 28.7 | 110 | 97 | 80 |
| Midwest | 137 | 156 | 171 | -18.0 | 159 | 149 | 129 |
| South | 621 | 617 | 556 | 23.0 | 497 | 467 | 400 |
| West | 311 | 248 | 265 | 30.0 | 236 | 217 | 175 |
| Building Permits | 1,103 | 1,161 | 1,130 | 4.4 | 1,052 | 987 | 829 |

Tom Moeller
AuthorMore in Author Profile »Prior to joining Haver Analytics in 2000, Mr. Moeller worked as the Economist at Chancellor Capital Management from 1985 to 1999. There, he developed comprehensive economic forecasts and interpreted economic data for equity and fixed income portfolio managers. Also at Chancellor, Mr. Moeller worked as an equity analyst and was responsible for researching and rating companies in the economically sensitive automobile and housing industries for investment in Chancellor’s equity portfolio. Prior to joining Chancellor, Mr. Moeller was an Economist at Citibank from 1979 to 1984. He also analyzed pricing behavior in the metals industry for the Council on Wage and Price Stability in Washington, D.C. In 1999, Mr. Moeller received the award for most accurate forecast from the Forecasters' Club of New York. From 1990 to 1992 he was President of the New York Association for Business Economists. Mr. Moeller earned an M.B.A. in Finance from Fordham University, where he graduated in 1987. He holds a Bachelor of Arts in Economics from George Washington University.
More Economy in Brief