 Global| Oct 20 2009
U.S. Housing Starts Inch Higher During September But Are Flat Over Last Four Months
by:Tom Moeller
|in:Economy in Brief
Summary
Continuing to show a loss of forward momentum was the housing sector. Housing starts ticked up slightly last month to 590,000 (AR) units versus 587,000 during August which was revised down slightly. The latest level, however, showed [...]
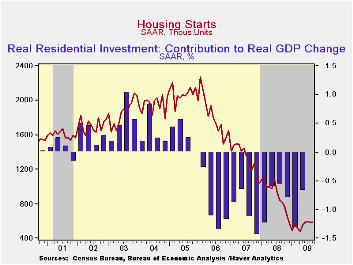
Continuing to show a loss of forward momentum was the housing sector. Housing starts ticked up slightly last month to 590,000 (AR) units versus 587,000 during August which was revised down slightly. The latest level, however, showed no growth from June. In addition, September's figure fell short of Consensus expectations for 610,000 starts.
The loss of momentum owes to weakness in the multi-family sector where starts fell 15.2% m/m during September. That decline reversed roughly all of the August increase and left multi-family starts near the postwar low. Starts of apartments, condominiums & town houses remained down by roughly two-thirds from the 2006 peak.
Starts of single-family homes have shown more life recently. Single-family starts rose 3.9% last month to 501,000 units (AR) and reversed most of an August decline. They are now 40% above the low of this past winter. During the last ten years, there has been an 84% correlation between the q/q change in single-family starts and their contribution to quarterly GDP growth.
By region, starts of single-family units last month were mixed. Single-family starts in the Northeast rose 13.0% to nearly their highest level since October (-8.8% y/y) while starts in the South also rose 14.3% (-5.9% y/y) to their highest level since last September. In the Midwest, starts posted a 5.7% (-4.6% y/y) decline after a dip during August and starts in the West fell 14.4% (-18.8% y/y) to their lowest level since May. 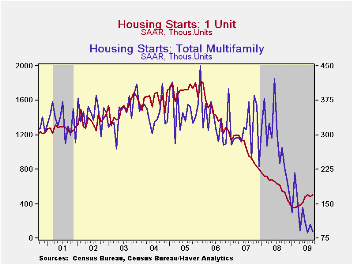
Building permits fell 1.2% and gave back much of their increase during August. Permits remained just above their record low and were down by roughly one-half from last May. As with starts, permits to build a single-family home have been relatively strong, despite a moderate 3.0% decline during September. A leading indicator of starts, permits are one-third higher than their winter low.
The housing starts figures can be found in Haver's USECON database.
| Housing Starts (000s, SAAR) | September | August | Y/Y | 2008 | 2007 | 2006 |
|---|---|---|---|---|---|---|
| Total | 590 | 587 | -28.2% | 900 | 1,342 | 1,812 |
| Single-Family | 501 | 482 | -8.7 | 616 | 1,036 | 1,474 |
| Multi-Family | 89 | 105 | -67.4 | 285 | 306 | 338 |
| Building Permits | 573 | 580 | -28.9 | 895 | 1,392 | 1,844 |

Tom Moeller
AuthorMore in Author Profile »Prior to joining Haver Analytics in 2000, Mr. Moeller worked as the Economist at Chancellor Capital Management from 1985 to 1999. There, he developed comprehensive economic forecasts and interpreted economic data for equity and fixed income portfolio managers. Also at Chancellor, Mr. Moeller worked as an equity analyst and was responsible for researching and rating companies in the economically sensitive automobile and housing industries for investment in Chancellor’s equity portfolio. Prior to joining Chancellor, Mr. Moeller was an Economist at Citibank from 1979 to 1984. He also analyzed pricing behavior in the metals industry for the Council on Wage and Price Stability in Washington, D.C. In 1999, Mr. Moeller received the award for most accurate forecast from the Forecasters' Club of New York. From 1990 to 1992 he was President of the New York Association for Business Economists. Mr. Moeller earned an M.B.A. in Finance from Fordham University, where he graduated in 1987. He holds a Bachelor of Arts in Economics from George Washington University.
More Economy in Brief


