 Global| Apr 16 2010
U.S. Housing Starts Improve With Better Weather
by:Tom Moeller
|in:Economy in Brief
Summary
Improved weather last month helped housing starts rise 1.6% from February to 626,000 units (AR). Also good news from the housing sector was that snowstorms didn't depress activity by 5.9% from January as previously reported but [...]
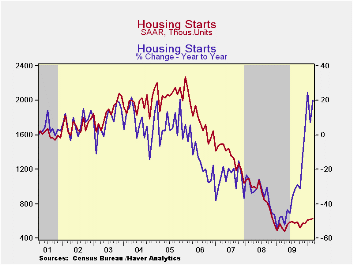
Improved weather last month helped housing starts rise 1.6% from February to 626,000 units (AR). Also good news from the housing sector was that snowstorms didn't depress activity by 5.9% from January as previously reported but instead February starts rose modestly. Consensus expectations had been for 610,000 starts in March.
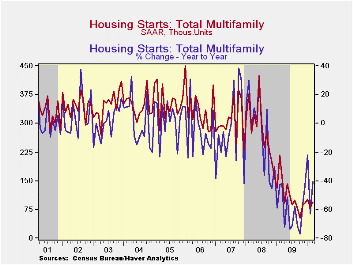
Starts of multi-family housing units accounted for the increase in March activity. Moreover, the upward revision to February to a lesser decline from January was behind much of the revision. Starts of apartments, condominiums & town houses recovered most of the February decline with an 18.8% increase but they still were down 40.6% from last March. Regardless, the q/q increase in starts was the first of this cycle.
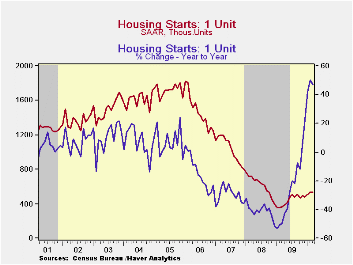
Despite their 0.9% m/m decline from February, starts of single-family homes also showed improvement. The decline was from an upwardly revised February level. It now shows an increase from January instead of the sharp decline reported earlier. Starts rose 48.7% from the recession low during February 2009. Single-family starts in the Northeast rose 5.6% during March and were more-than-double the January '09 low. In the Midwest, single-family starts fell by one-third from February (+19.0% y/y) and reversed all of the February gain. Though starts rose from their January '09 low ,they remained down three-quarters from the 2005 high. Starts in the South rose 9.9% (47.7% y/y) and in the West they rose 0.9% (82.8% y/y).
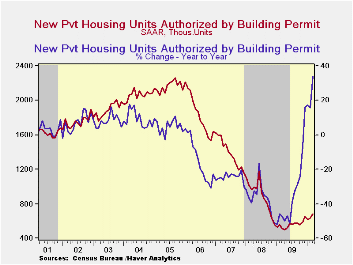
During March, building permits rose 7.5% following a 2.4% February increase. Permits to build a single-family home rose 5.6% and were up 58.8% from the low in January '09. Permits to build multi-family homes rose 15.4% and were 40.6% higher than their low last July.
The housing starts figures can be found in Haver's USECON database.
Coordination of Expectations in the Recent Crisis: Private Actions and Policy Responses from the Federal Reserve Bank of Kansas City is available here.
| Housing Starts (000s, SAAR) | March | February | January | March Y/Y | 2009 | 2008 | 2007 |
|---|---|---|---|---|---|---|---|
| Total | 626 | 616 | 609 | 20.2% | 553 | 900 | 1,342 |
| Single-Family | 531 | 536 | 507 | 47.1 | 440 | 616 | 1,036 |
| Multi-Family | 95 | 80 | 102 | -40.6 | 113 | 285 | 306 |
| Building Permits | 685 | 637 | 622 | 34.1 | 558 | 895 | 1,392 |

Tom Moeller
AuthorMore in Author Profile »Prior to joining Haver Analytics in 2000, Mr. Moeller worked as the Economist at Chancellor Capital Management from 1985 to 1999. There, he developed comprehensive economic forecasts and interpreted economic data for equity and fixed income portfolio managers. Also at Chancellor, Mr. Moeller worked as an equity analyst and was responsible for researching and rating companies in the economically sensitive automobile and housing industries for investment in Chancellor’s equity portfolio. Prior to joining Chancellor, Mr. Moeller was an Economist at Citibank from 1979 to 1984. He also analyzed pricing behavior in the metals industry for the Council on Wage and Price Stability in Washington, D.C. In 1999, Mr. Moeller received the award for most accurate forecast from the Forecasters' Club of New York. From 1990 to 1992 he was President of the New York Association for Business Economists. Mr. Moeller earned an M.B.A. in Finance from Fordham University, where he graduated in 1987. He holds a Bachelor of Arts in Economics from George Washington University.
More Economy in Brief


