 Global| Oct 17 2008
U.S. Housing Starts Fell Further in September
by:Tom Moeller
|in:Economy in Brief
Summary
Housing starts fell 6.3% m/m last month to 817,000 units (SAAR). That followed an 8.1% decline during August which was deeper than reported initially. The latest level was the lowest since 921,000 starts during January 1991. Consensus [...]
Housing starts fell 6.3% m/m last month to 817,000 units (SAAR). That followed an 8.1% decline during August which was deeper than reported initially. The latest level was the lowest since 921,000 starts during January 1991. Consensus expectations had been for 874,000 starts.
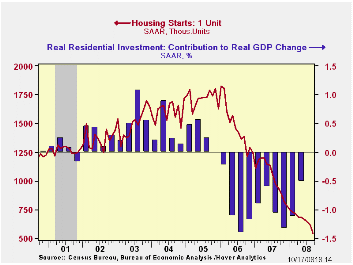
During September, starts of single-family homes fell by 12.0% to 544,000 units, their lowest level since late-1981. Since their peak in early 2006, single-family starts are down by roughly two-thirds. Permits to build these single family homes also fell 3.8% (-38.9% y/y) to 532,000, their lowest since the recession during 1982.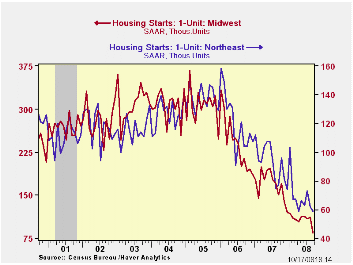
Starts during 2Q fell by 7.2% from 1Q and that decline was accompanied by a 0.5 percentage point subtraction from real GDP growth. In 3Q, single-family starts fell 10.9% from the 2Q average. These new figures suggest that housing this quarter will even more of drag on GDP. During the last ten years there has been an 84% correlation between the q/q change in single-family starts and the contribution to quarterly GDP growth.
Multi-family starts in September recouped just a bit of their earlier declines with a 7.5% increase. Nonetheless, 3Q starts fell 20.7% from 2Q after that period's 7.5%.
By region, August starts of single-family units in the Northeast fell 4.8% (-23.4% y/y) to a new low. In the Midwest starts fell an even harder 24.1% (-43.3% y/y). In the South single family starts fell 6.3% (-42.3% y/y) while in the West starts dropped 17.7% (-45.5% y/y) and erased all of the prior months' gains.
Housing Busts and Household Mobility from the Federal Reserve Bank of New York can be found here.
| Housing Starts (000s, SAAR) | September | August | July | Y/Y | 2007 | 2006 | 2005 |
|---|---|---|---|---|---|---|---|
| Total | 817 | 872 | 949 | -31.1% | 1,341 | 1,812 | 2,073 |
| Single-Family | 544 | 618 | 644 | -41.9 | 1,034 | 1,474 | 1,719 |
| Multi-Family | 273 | 254 | 305 | 9.6 | 307 | 338 | 354 |
| Building Permits | 786 | 857 | 937 | -38.4 | 1,389 | 1,844 | 2,160 |

Tom Moeller
AuthorMore in Author Profile »Prior to joining Haver Analytics in 2000, Mr. Moeller worked as the Economist at Chancellor Capital Management from 1985 to 1999. There, he developed comprehensive economic forecasts and interpreted economic data for equity and fixed income portfolio managers. Also at Chancellor, Mr. Moeller worked as an equity analyst and was responsible for researching and rating companies in the economically sensitive automobile and housing industries for investment in Chancellor’s equity portfolio. Prior to joining Chancellor, Mr. Moeller was an Economist at Citibank from 1979 to 1984. He also analyzed pricing behavior in the metals industry for the Council on Wage and Price Stability in Washington, D.C. In 1999, Mr. Moeller received the award for most accurate forecast from the Forecasters' Club of New York. From 1990 to 1992 he was President of the New York Association for Business Economists. Mr. Moeller earned an M.B.A. in Finance from Fordham University, where he graduated in 1987. He holds a Bachelor of Arts in Economics from George Washington University.
More Economy in Brief


