 Global| Aug 18 2009
U.S. Housing Starts Dip During July After Two Months Of Strong Gains Multi-family Starts Revisit Record Low
by:Tom Moeller
|in:Economy in Brief
Summary
After two months of fairly strong increases, the momentum in the housing sector paused last month. Housing starts dipped to 581,000 (AR) units versus 587,000 during June, a level which was revised up slightly from the initial report. [...]
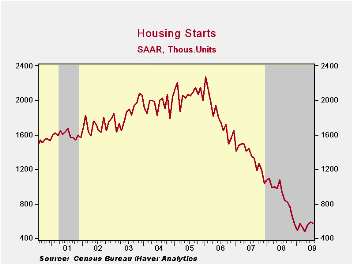
After two months of fairly strong increases, the momentum in the housing sector paused last month. Housing starts dipped to 581,000 (AR) units versus 587,000 during June, a level which was revised up slightly from the initial report. The latest figure fell somewhat short of Consensus expectations for 600,000 starts.
Despite the overall decline, starts of single-family homes rose 1.7% for the fifth straight month. The gains pushed the series 37.3% off the record low which dates back to 1959. During the last ten years, there has been an 84% correlation between the q/q change in single-family starts and their contribution to quarterly GDP growth.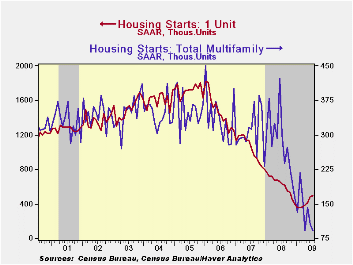
Starts of multi-family homes fell hard again to 91,000 which was the record low for the series. Starts of apartments, condominiums & town houses remained down by roughly two-thirds from the 2006 peak.
By region starts of single-family units last month were mixed across the country. Single-family starts in the Northeast rose 14.0% to their highest level since October (-16.2% y/y). Starts in the West ticked up 1.9% for the fifth straight month of increase (-23.6% y/y) and in the South single-family starts also ticked up by 0.8% (-23.4% y/y). In the Midwest starts fell a modest 3.4% (-22.2% y/y) after five consecutive months of increase.
Overall, building permits fell 1.8% and gave back a piece of their 10.0% jump during June. Permits remained just above the record low and permits were down by roughly one-half from last May. As with starts, recent gains in building permits have been led by the single-family sector, a leading indicator of starts. During July, permits rose for the fourth straight month and were up 23.8% since December (-20.3% y/y).
The housing starts figures can be found in Haver's USECON database.
Examining the Housing Crisis by Home Price Tier from the Federal Reserve Bank of St. Louis can be found here.
| Housing Starts (000s, SAAR) | July | June | Y/Y | 2008 | 2007 | 2006 |
|---|---|---|---|---|---|---|
| Total | 581 | 587 | -37.7% | 900 | 1,342 | 1,812 |
| Single-Family | 490 | 482 | -22.5 | 616 | 1,036 | 1,474 |
| Multi-Family | 91 | 105 | -69.8 | 285 | 306 | 338 |
| Building Permits | 560 | 570 | -39.4 | 895 | 1,392 | 1,844 |

Tom Moeller
AuthorMore in Author Profile »Prior to joining Haver Analytics in 2000, Mr. Moeller worked as the Economist at Chancellor Capital Management from 1985 to 1999. There, he developed comprehensive economic forecasts and interpreted economic data for equity and fixed income portfolio managers. Also at Chancellor, Mr. Moeller worked as an equity analyst and was responsible for researching and rating companies in the economically sensitive automobile and housing industries for investment in Chancellor’s equity portfolio. Prior to joining Chancellor, Mr. Moeller was an Economist at Citibank from 1979 to 1984. He also analyzed pricing behavior in the metals industry for the Council on Wage and Price Stability in Washington, D.C. In 1999, Mr. Moeller received the award for most accurate forecast from the Forecasters' Club of New York. From 1990 to 1992 he was President of the New York Association for Business Economists. Mr. Moeller earned an M.B.A. in Finance from Fordham University, where he graduated in 1987. He holds a Bachelor of Arts in Economics from George Washington University.
More Economy in Brief


