 Global| Jun 05 2008
U.S. Household Net Worth Down Again
by:Tom Moeller
|in:Economy in Brief
Summary
The net worth of the U.S. household sector deteriorated during 1Q to $55.97 trillion, down from the 3Q '07 record level of $58.196B. Net worth last quarter also fell 1.0% from a year earlier value of $56.532B Household sector assets [...]
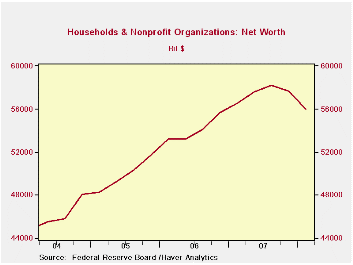
The net worth of the U.S. household sector deteriorated during 1Q to $55.97 trillion, down from the 3Q '07 record level of $58.196B. Net worth last quarter also fell 1.0% from a year earlier value of $56.532B
Household sector assets fell $1.6 trillion (-2.2%, +0.4% y/y) due to a $255.8 billion decline (-1.0%, +0.4% y/y) in tangible asset values. Real estate asset values fell 1.4% (-0.4% y/y). Financial asset values fell a harder 2.9% (+0.5% y/y) with the lower stock market. Total liabilities grew 0.7% (6.4% y/y).
Credit market debt outstanding owed by all sectors of the economy grew 8.5% AR (9.0 % y/y) during the first quarter of 2008 as the government's larger budget deficit boosted government debt obligations by 5.7% y/y. Still, the y/y rise was about half the peak 10.9% rise during 2003.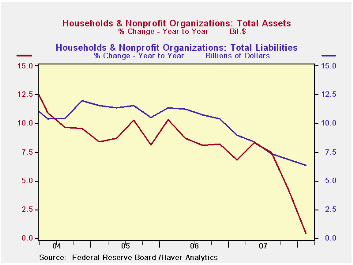
Household sector credit debt growth slowed to a 3.0% quarterly rate (6.4% y/y) with the slower economy. That was half the growth during 2004. As home purchases dropped, households' obligations on mortgages grew just 2.7% (5.5% y/y) and that was the lowest quarterly gain since early 1993. Consumer credit dropped at a 2.1% rate (+6.0% y/y) while bank loans surged to another high.
Credit market debt owed by the nonfinancial corporate business sector grew at a quarterly rate of 8.3% (10.8% y/y) which was near the strongest gain in ten years. The non-corporate business sector's debt owed also sped up (13.2% y/y).
Credit market debt growth owed by the financial sector decelerated to a 4.6% rate (10.2% y/y).
Banking Globalization, Monetary Transmission, and the Lending Channel is a paper recently presented by authors from the Federal Reserve Bank of New York. It is available here.
| Flow of Funds (Y/Y % Chg.) | % of Total | 1Q '08 | 4Q'07 | 2007 | 2006 | 2005 |
|---|---|---|---|---|---|---|
| Total Credit Market Debt Outstanding | -- | 8.5 | 9.0 | 9.0 | 9.4 | 8.9 |
| Federal Government | 11% | 5.7 | 4.9 | 4.9 | 3.9 | 7.0 |
| Households | 28% | 5.9 | 6.8 | 6.8 | 10.2 | 11.1 |
| Nonfinancial Corporate Business | 13% | 10.8 | 11.1 | 11.1 | 8.2 | 4.8 |
| Nonfarm, NonCorporate Business | 7% | 13.2 | 13.4 | 13.4 | 12.6 | 13.6 |
| Financial Sectors | 32% | 10.2 | 11.2 | 11.2 | 10.0 | 8.5 |
| Net Worth: Households & Nonprofit Organizations (Trillions) | -- | $55.970 | $57.666 | $57.666 | $55.677 | $51.716 |
| Tangible Assets: Households | -- | $26.395 | $26.650 | $26.650 | $25.964 | $24.385 |
| Financial Assets: Households | -- | $44.071 | $45.405 | $45.405 | $43.175 | $39.528 |

Tom Moeller
AuthorMore in Author Profile »Prior to joining Haver Analytics in 2000, Mr. Moeller worked as the Economist at Chancellor Capital Management from 1985 to 1999. There, he developed comprehensive economic forecasts and interpreted economic data for equity and fixed income portfolio managers. Also at Chancellor, Mr. Moeller worked as an equity analyst and was responsible for researching and rating companies in the economically sensitive automobile and housing industries for investment in Chancellor’s equity portfolio. Prior to joining Chancellor, Mr. Moeller was an Economist at Citibank from 1979 to 1984. He also analyzed pricing behavior in the metals industry for the Council on Wage and Price Stability in Washington, D.C. In 1999, Mr. Moeller received the award for most accurate forecast from the Forecasters' Club of New York. From 1990 to 1992 he was President of the New York Association for Business Economists. Mr. Moeller earned an M.B.A. in Finance from Fordham University, where he graduated in 1987. He holds a Bachelor of Arts in Economics from George Washington University.
More Economy in Brief


