 Global| Jun 10 2016
U.S. Home Affordability Is Eroded by Higher Prices
by:Tom Moeller
|in:Economy in Brief
Summary
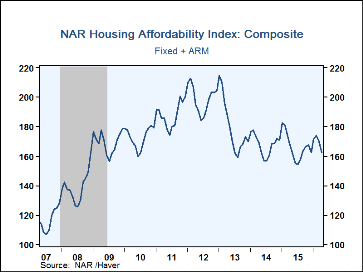
The National Association of Realtors reported that the Composite Index of Home Affordability declined 4.5% during April to 162.4, the lowest level since August. The index was 24.3% lower than its peak in January 2014. During the last [...]
The National Association of Realtors reported that the Composite Index of Home Affordability declined 4.5% during April to 162.4, the lowest level since August. The index was 24.3% lower than its peak in January 2014. During the last ten years, there has been a 62% correlation between the affordability index level and the y/y change in existing single-family home sales.
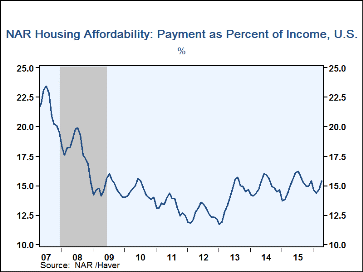
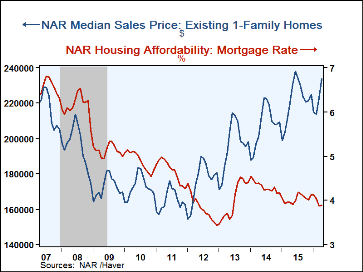
Strong home sales, which are near the highest level since early-2007, have been accompanied by higher prices. The median sales price of an existing home strengthened 4.8% (6.2% y/y) to $233,700, the highest level since June. The price rise was accompanied by an average mortgage rate of 3.89%, little changed m/m and the lowest level in nearly three years. Together, principal & interest payments rose to $881, or 15.4% of median income. That percentage compared to a low of 11.7% early in 2013.
The Housing Affordability Index equals 100 when median family income qualifies for an 80% mortgage on a median priced existing single-family home. A rising index indicates more buyers can afford to enter the home-buying market. Data on Home Affordability can be found in Haver's REALTOR database. Interest rate data can be found in the WEEKLY and DAILY databases.
To Reshore or Not to Reshore, That Is the Question from the Federal Reserve Bank of Atlanta is available here.
| Housing Affordability | Apr | Mar | Feb | Apr Y/Y | 2015 | 2014 | 2013 |
|---|---|---|---|---|---|---|---|
| Composite Index | 162.4 | 170.1 | 173.8 | -3.0% | 166.1 | 167.8 | 179.7 |
| Median Sales Price (Existing Single Family Home) | $233,700 | $223,100 | $213,600 | 6.2% | $221,350 | $207,125 | $195,933 |
| Monthly Mortgage Rate | 3.89% | 3.87% | 4.04% | 3.95% | 4.03% | 4.30% | 4.00% |
| Principal and Interest Payment | $881 | $839 | $820 | 5.5% | $849 | $820 | $750 |
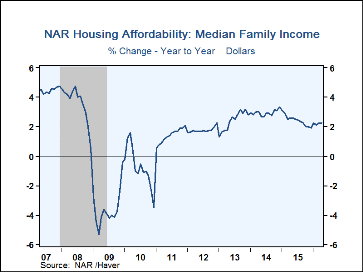
| Median Family Income | $68,665 | $68,509 | $68,405 | 2.3% | $67,507 | $65,910 | $64,030 |
| Payment as a Percent of Income | 15.4 | 14.7 | 14.4 | 14.9 | 15.1 | 14.9 | 14.0 |
Tom Moeller
AuthorMore in Author Profile »Prior to joining Haver Analytics in 2000, Mr. Moeller worked as the Economist at Chancellor Capital Management from 1985 to 1999. There, he developed comprehensive economic forecasts and interpreted economic data for equity and fixed income portfolio managers. Also at Chancellor, Mr. Moeller worked as an equity analyst and was responsible for researching and rating companies in the economically sensitive automobile and housing industries for investment in Chancellor’s equity portfolio. Prior to joining Chancellor, Mr. Moeller was an Economist at Citibank from 1979 to 1984. He also analyzed pricing behavior in the metals industry for the Council on Wage and Price Stability in Washington, D.C. In 1999, Mr. Moeller received the award for most accurate forecast from the Forecasters' Club of New York. From 1990 to 1992 he was President of the New York Association for Business Economists. Mr. Moeller earned an M.B.A. in Finance from Fordham University, where he graduated in 1987. He holds a Bachelor of Arts in Economics from George Washington University.
More Economy in Brief
 Global| Feb 05 2026
Charts of the Week: Balanced Policy, Resilient Data and AI Narratives
by:Andrew Cates


