 Global| May 06 2008
U.S. Gasoline Prices Stable at $3.61 per Gallon, WTI Crude Down
by:Tom Moeller
|in:Economy in Brief
Summary
The retail price for a gallon of regular gasoline was relatively stable last week. A penny rise to $3.61 per gallon, according to the U.S. Department of Energy survey, followed a ten cent increase during the last week of April.Prices [...]
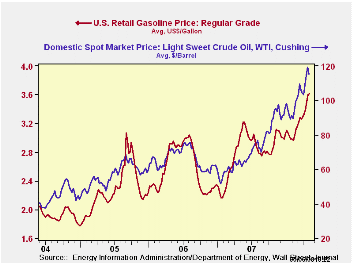
The retail price for a gallon of regular gasoline was relatively stable last week. A penny rise to $3.61 per gallon, according to the U.S. Department of Energy survey, followed a ten cent increase during the last week of April.Prices have risen 56 cents (18.3%) since the end of last year.
Spot market prices for gasoline rose further yesterday. The wholesale price for a gallon of non-oxygenated gasoline was $2.94 per gallon, up eight cents from Friday and up ten cents from last week's average.
During all of last week, the price of a barrel of WTI crude oil fell nearly four dollars w/w to an average of $115.34. Yesterday, however, the price recovered sharply to $119.97. The record was reached during the third week of April prices reached $121.57.
Natural gas prices also have move higher. Yesterday's wholesale price of natural gas at $10.88 per mmbtu was up from Friday's price and up from last week's average of $10.74/mmbtu.
Weekly gasoline prices can be found in Haver's WEEKLY database, daily prices are found in the DAILY database.
Mortgage Delinquencies and Foreclosures are yesterday's remarks by Fed Chairman Ben S. Bernancke and they can be found here.
| Weekly Prices | 05/05/08 | 04/21/08 | Y/Y | 2007 | 2006 | 2005 |
|---|---|---|---|---|---|---|
| Retail Gasoline ($ per Gallon) | 3.61 | 3.60 | 18.3% | 2.80 | 2.57 | 2.27 |
| Light Sweet Crude Oil, WTI ($ per bbl.) | 115.34 | 119.21 | 80.8% | 72.25 | 66.12 | 56.60 |
by Tom Moeller May 6, 2008
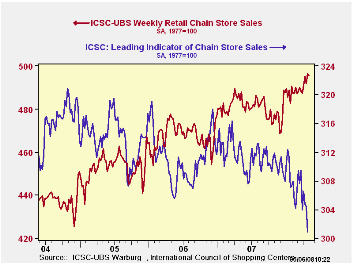
In its ICSC-UBS Chain Store survey, the International Council of Shopping Centers reported that sales dipped 0.2% last week after the prior period's 0.9% rise.
During all of April sales rose 1.0% from March and they began May up another 0.4%.
During the last ten years there has been a 45% correlation
between the y/y change in chain store sales and the change in nonauto
retail sales less gasoline.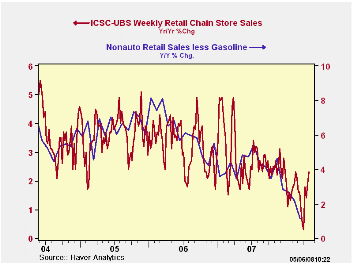
The ICSC-UBS retail chain-store sales index is constructed using the same-store sales (stores open for one year) reported by 78 stores of seven retailers: Dayton Hudson, Federated, Kmart, May, J.C. Penney, Sears and Wal-Mart.
During the latest week, the leading indicator of chain store sales from ICSC-UBS fell a sharp 1.2% (-3.7% y/y) and it has been declining steadily for more than a year.
The chain store sales figures are available in Haver's SURVEYW database.
The April 2008 Senior Loan Officer Opinion Survey on Bank Lending Practices from the Federal Reserve Board is available here.
| ICSC-UBS (SA, 1977=100) | 05/03/08 | 04/26/08 | Y/Y | 2007 | 2006 | 2005 |
|---|---|---|---|---|---|---|
| Total Weekly Chain Store Sales | 496.3 | 491.8 | 2.3% | 2.8% | 3.3% | 3.6% |
by Louise Curley May 6, 2008
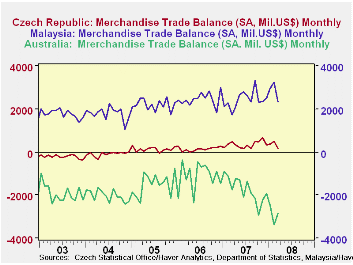
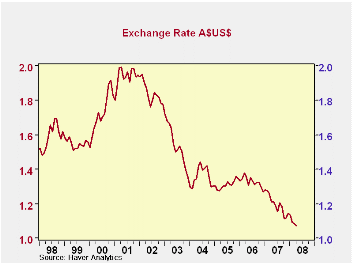
The Czech Republic, Australia and Malaysia reported their March trade balances today. The monthly data are shown in the first chart. Australia showed improvement as its deficit declined by A$536 million from February to A$2,544 million in March. Exports of wheat, coal and iron ore were particularly strong.
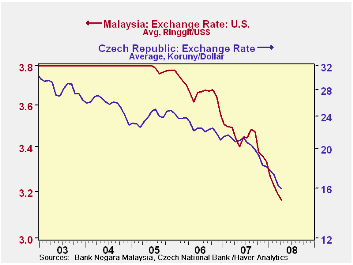
Both Malaysia and the Czech Republic reported lower trade surpluses in March than in February due to a greater decline in exports than in imports. For Malaysia, the March trade surplus was US$2,302 million compared with US$ 3,269 million in February. For the Czech Republic, the March trade surplus was US$182 million, compared with US$505 million in February. Czech data on the composition and direction of exports and imports are not available. Malaysian data on the composition of exports and imports are available but on a delayed schedule. Some such data are available for February but most are only available for January or the 4th quarter of 2007.
It is to be expected that the slowdown in the US economy and the appreciation of their currencies are affecting the trade balances of most countries. The appreciation in Australia's exchange rate is shown in the second chart and those of the Czech Republic and Malaysia in the third chart.
| BALANCES ON TRADE IN MERCHANDISE GOODS | Mar 08 | Feb 08 | Mar 07 | M/M Chg | Y/Y Chg | 2007 | 2006 | 2005 |
|---|---|---|---|---|---|---|---|---|
| Australia | -2844 | -3380 | -1766 | 536 | -1078 | -20873 | -13268 | -18007 |
| Malaysia | 2302 | 3269 | 1719 | -967 | 583 | 29219 | 29528 | 36346 |
| Czech Republic | 182 | 505 | 462 | -324 | -280 | 4244 | 1777 | 1607 |
| Q1 08 | Q4 07 | Q1 07 | Q/Q Chg | Y/Y Chg | 2007 | 2006 | 2005 | |
| Australia | -8703 | -7073 | -3794 | -1630 | -4909 | -- | -- | -- |
| Malaysia | 8504 | 7182 | 6135 | 1323 | 2405 | -- | -- | -- |
| Czech Republic | 1059 | 1478 | 1025 | -419 | 30 | -- | -- | -- |
by Robert Brusca May 6, 2008
The Euro Area is an unwieldy beast…but it’s getting weaker. The Euro Area is a complex beast to follow because it has some many moving parts to follow. Its data are a mish-mash of new indicators constructed to help us better understand the Zone while competing with the legacy reports on a country by country basis. This framework fights against the notion that the EMU is truly one region. If the EMU wanted to enhance its sense of being one zone it might construct specific REGIONAL indices and submerge the ones that preserve nationalistic boundaries or issue those with a delay. The US, for example issues a broad mix of data on a state by state basis but these breakdowns often are not timely and are not headline reports and you have to dig a bit to find them. They do not come in advance of national data. By contrast, in EMU, the thing that makes national-source data headline data is timeliness. Some countries’ reports are available ahead of the EMU-wide reports by nearly a month in some cases. The US does have other indicators that feature chopped up geographical bits ranging from the four quadrant US presentation (NE, MW, S, & W) to something a bit more esoteric that is offered up by the Conference Board, for example when it reports consumer confidence. Even the Federal Reserve district banks split states in some cases. Of course, in the case of the ECB, it is central bank membership that gets you a seat on the council and every country wants a council seat… By definition the regional bank area is a country.
In any event the EMU issues data in these forms and we are left to try and make sense of it. We are happy to have country by country data because we have certain prior knowledge of these countries and their capabilities - we think we can make some sense of this added input.
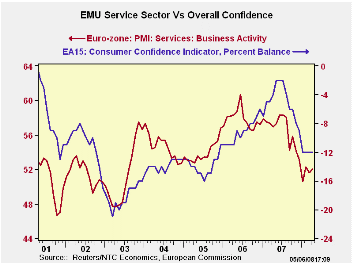
The EMU/EU Service Sector - will April showers make growth flower? This month we look at the revised EMU and EU (in the table only; the chart is all EMU data) reports on the services sector. We also compared data from some different sources as we try and get a handle on the service sector and some other trends on consumer confidence.
When we compare the NTC EMU readings to those of the EU Commission (EU-C) we find that the two very different gauges (one is an ISM type diffusion measure, the other a net balance ‘diffusion’ measure) actually reside at similar points in their respective ranges. The NTC report resides in the 35th percentile and the EU-C index for EMU resides in its 29th percentile. That’s a difference but both are placed in the roughly the same neighborhood - weak and near the bottom third of their respective ranges constructed since mid 2000.
The German conundrum. This month we also were intrigued by the fact that German consumer confidence measures were rising while German MFG and the world around Germany was having such trouble. The services indicators explain a lot of that dilemma. Germany’s services index stands in the 65th percentile of its range since Mid 2000 compared to the 71st percentile for German Consumer Confidence in the same period (EU-Commission measure).
While that is a lot of the story it is not all of it. The services sector is at a diffusion value of 54.9 in Germany and is clearly showing expansion. German consumer confidence is at a net reading of zero - at dead neutral. While Germany is coming off a period of relatively good growth in the past two years, going back to 2000 we capture a Germany that had been struggling. The German government is still hoping that the consumer will show up at the shops and help to bailout a fading economy. So while the consumer confidence range reading is relatively high in Germany it still may be challenged in absolute terms where the raw reading is dead flat. But this is an issue with diffusion that we want to confront head on.
Percentile readings VS raw survey levels. I actually prefer these range percentile readings to the raw PMI or EU-Commission readings (or the US ISM or the Philly Fed index-etc, etc) since we can see where the survey value lies relative some history immediately. Also these survey measures have components and we find that the components have very different tendencies from one another… in term of average readings and the range they cover and variability. Therefore an NTC reading of X for Germany may not be easy to compare with a reading of X for Spain or Italy. But if we express them as percentiles of their respective ranges we have a better understanding of their relative performance and the economic message. In truth there is more to be learned by looking at both the percentile and the raw reading. We provide both in the table.
Look at the table below. It has seven columns and sixteen rows of data. While you can conclude something in comparing values across any given row (the first six of them, anyway) you cannot compare data vertically and make any sense of it except for the final column labeled ‘percentile’. That column is the Rosetta Stone of the first column and permits comparison among the values in the first column even though each possesses an intrinsically different level by row, meaning that each country (or aggregate) is distinct. The final column looks at each with regard to own history for a fixed period of time in a way that gives intra column comparisons (cross section comparisons in economic parlance) meaning.
When we make these adjustments, what we see is that Germany is
setting off on its own course while the rest of EMU is largely in deep
pain.
What we can say about Euro Area services and consumer confidence. So as we peruse the Euro Area data this month we are trying to assess different measures of the same thing, as well as well as balancing state by state reports Vs EMU-wide readings.
When we put these things in context it is clear that Germany is doing leagues better than anyone else. Germany is no bellwether for the Euro Area. Germany’s service sector ranks rather high in its range. The service sector in France is in rotten shape with a percentile reading of 24% - the bottom quarter of its range - despite a raw reading that is not that much lower than Germany’s! Italy, Spain and Ireland’s respective percentiles are even worse and the UK standing is about the same as for France.
These readings correlate loosely with the evaluation of consumer sentiment which is very high in Germany but below neutral in France, standing in the 42nd percentile of its range (and sporting a negative raw reading). Italy is very weak. Spain, Ireland and the UK each post the weakest consumer sentiment readings on the EC Commission measures that they have had since mid 2000.
What it all means for Europe… On balance these are not good measures for Europe. Even the aggregate service sector reading with a VERY HEAVY GERMAN WEIGHT seems to do the region some disservice (35th percentile). It is always hard to tell how to characterize ‘the whole’ when its parts are divergent. We solve that problem in the US by mostly suppressing the regional differences, with a few exceptions.
With such a weak services sector, such low confidence, a lagging MFG sector to boot, and a currency that is at ALL TIME HIGHS in trade-weighted-inflation-adjusted terms, it is hard to get on the ECB’s inflation fighting bandwagon. It’s not that inflation is in great shape but that we know that inflation has stemmed from surging energy and food prices and now we can see the gathering storm clouds of economic weakness that should cap fears of second round effects and of price pass-throughs and of surging of wage deals. Already workers are showing some job insecurity.
The Euro-worm is turning. We can begin to see it in the value of the euro itself, since its climb has become somewhat less relentless recently. Still, oil prices carry the trappings of strength on episodic supply disruptions and maverick forecasts of still higher prices to come. With such weakness in the western developed economies and with the developing world depending on economies that are export oriented and deficient in domestic demand, it is hard to swallow the argument that these developing nations will be unaffected or little-affected. The developing world has always grown faster than its developed counterpart. This is nothing new. What is new is that it that developed economies as a group sport GDP that is LARGER relative to the developed world than in the past. While that may give it some resilience, it will leave these nations with no niche markets to nurture when developing nation demand falters. We think a global slowdown is in train and is already farther advanced in Europe than most admit.
Arguably, you can find the data that proves just about any forecast given the wide-ranging nature of Euro-data. We have tried to find the path that gives some of the main reports their objective due. I don’t set one indicator above another. But, when we see them all in equal light the picture is darker than an aging Rembrandt and considerably less pleasing. Moreover, we see the ECB with its finger in the wrong dike.
| NTC Services Indices for EU/EMU | |||||||
|---|---|---|---|---|---|---|---|
| Apr-08 | Mar-08 | Feb-08 | 3Mo | 6Mo | 12Mo | Percentile | |
| Euro-13 | 51.98 | 51.61 | 52.29 | 51.96 | 52.29 | 54.64 | 35.7% |
| Germany | 54.92 | 51.83 | 52.17 | 52.97 | 52.07 | 54.60 | 65.7% |
| France | 52.82 | 57.25 | 58.15 | 56.07 | 57.14 | 57.70 | 24.4% |
| Italy | 49.81 | 48.76 | 47.15 | 48.57 | 49.01 | 52.69 | 16.9% |
| Spain | 42.50 | 40.89 | 46.13 | 43.17 | 45.91 | 50.13 | 8.1% |
| Ireland | 45.19 | 48.13 | 48.27 | 47.20 | 49.97 | 53.00 | 1.6% |
| EU only | |||||||
| UK (CIPs) | 50.35 | 52.11 | 54.05 | 52.17 | 52.21 | 54.38 | 28.5% |
| EU Commission Indices for EU and EMU | |||||||
| EU Index | Apr-08 | Mar-08 | Feb-08 | 3Mo | 6Mo | 12Mo | Percentile |
| EU Services | 6 | 11 | 6 | -12.00 | -10.83 | -7.25 | 39.1% |
| EMU | Apr-08 | Mar-08 | Feb-08 | 3Mo | 6Mo | 12Mo | Percentile |
| Services | 7 | 9 | 10 | 8.67 | 11.00 | 15.67 | 29.7% |
| Cons Confidence | -12 | -12 | -12 | -12.00 | -10.83 | 8.03 | 39.1% |
| Consumer confidence by country | |||||||
| Germany | 0 | -2 | -3 | -1.67 | -0.17 | 3.86 | 71.9% |
| France | -15 | -15 | -14 | -14.67 | -13.33 | -3.97 | 42.4% |
| Ital | -23 | -25 | -23 | -23.67 | -22.83 | -8.58 | 7.4% |
| Spain | -25 | -19 | -21 | -21.67 | -20.17 | -15.19 | 0.0% |
| Ireland | -24 | -20 | -22 | -22.00 | -21.50 | -17.61 | 0.0% |
| UK | -13 | -10 | -9 | -10.67 | -8.00 | -12.36 | 0.0% |
| percentile is over range since May 2000 | |||||||

Tom Moeller
AuthorMore in Author Profile »Prior to joining Haver Analytics in 2000, Mr. Moeller worked as the Economist at Chancellor Capital Management from 1985 to 1999. There, he developed comprehensive economic forecasts and interpreted economic data for equity and fixed income portfolio managers. Also at Chancellor, Mr. Moeller worked as an equity analyst and was responsible for researching and rating companies in the economically sensitive automobile and housing industries for investment in Chancellor’s equity portfolio. Prior to joining Chancellor, Mr. Moeller was an Economist at Citibank from 1979 to 1984. He also analyzed pricing behavior in the metals industry for the Council on Wage and Price Stability in Washington, D.C. In 1999, Mr. Moeller received the award for most accurate forecast from the Forecasters' Club of New York. From 1990 to 1992 he was President of the New York Association for Business Economists. Mr. Moeller earned an M.B.A. in Finance from Fordham University, where he graduated in 1987. He holds a Bachelor of Arts in Economics from George Washington University.
More Economy in Brief


