 Global| Aug 14 2009
U.S. Factory Production Improves Sharply With Higher Auto Output
by:Tom Moeller
|in:Economy in Brief
Summary
A consistent indicator of turning points in the U.S. economy has been industrial output. And last month it signaled growth. Industrial output, which includes mining and utilities, rose a greater-than-expected 0.5% during July after an [...]
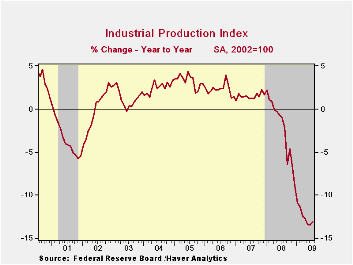
Output of consumer goods overall jumped 0.7% during July led by a 17.3% surge in auto production (-22.2% y/y). But that's only a partial indication of a change from the widespread downward momentum in industry output. Furniture & appliance output slipped 0.1% (-22.3% y/y) as consumers continued to defer purchases of large durable goods. Consumer nondurables output fell 0.9% with a decline in chemical products products production but output of business equipment rose 0.5% (-17.3% y/y. The output of construction supplies slipped 0.1% (-20.9% y/y).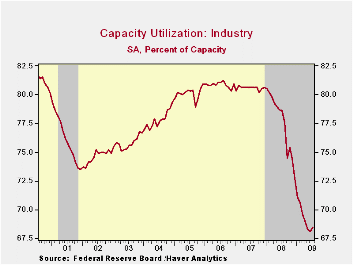
In the the high-tech sector the rate of decline in output also has slowed. Industrial production of high tech equipment slipped 0.1% last month. Less high tech, manufacturing industrial production jumped 1.0% last month and the annual rate of change eased to -9.8% over the last seven months. Outside of the auto and high-tech sectors together, output rose 0.1% for the first increase since last October.
Excess capacity diminshed slightly with the rise in production. Capacity utilization rose from its record low to 68.5%. The series dates back to 1966. Utilization in the factory sector also improved to 65.4%, still down from a peak near 80% back in 2007.
The industrial production data are available in Haver's USECON database.
| INDUSTRIAL PRODUCTION (SA, %) | July | June | Y/Y | 2008 | 2007 | 2006 |
|---|---|---|---|---|---|---|
| Total Output | 0.5 | -0.4 | -13.0 | -2.2 | 1.5 | 2.3 |
| Manufacturing | 1.0 | -0.5 | -14.4 | -3.2 | 1.4 | 2.5 |
| Consumer Goods | 0.7 | -0.6 | -7.2 | -2.6 | 0.9 | 0.4 |
| Business Equipment | 0.5 | -0.7 | -17.3 | -1.1 | 2.7 | 9.4 |
| Construction Supplies | -0.1 | -0.4 | -20.9 | -6.3 | -2.0 | 2.3 |
| Utilities | -2.5 | 0.9 | -4.9 | 0.3 | 3.4 | -0.6 |
| Capacity Utilization | 68.5 | 68.1 | 78.6 (July '08) | 77.6 | 80.6 | 80.9 |

Tom Moeller
AuthorMore in Author Profile »Prior to joining Haver Analytics in 2000, Mr. Moeller worked as the Economist at Chancellor Capital Management from 1985 to 1999. There, he developed comprehensive economic forecasts and interpreted economic data for equity and fixed income portfolio managers. Also at Chancellor, Mr. Moeller worked as an equity analyst and was responsible for researching and rating companies in the economically sensitive automobile and housing industries for investment in Chancellor’s equity portfolio. Prior to joining Chancellor, Mr. Moeller was an Economist at Citibank from 1979 to 1984. He also analyzed pricing behavior in the metals industry for the Council on Wage and Price Stability in Washington, D.C. In 1999, Mr. Moeller received the award for most accurate forecast from the Forecasters' Club of New York. From 1990 to 1992 he was President of the New York Association for Business Economists. Mr. Moeller earned an M.B.A. in Finance from Fordham University, where he graduated in 1987. He holds a Bachelor of Arts in Economics from George Washington University.
More Economy in Brief


