 Global| Oct 02 2008
U.S. Factory Inventory Level Continued Higher
by:Tom Moeller
|in:Economy in Brief
Summary
Factory inventories increased another 0.6% during August, the same as during July. That lifted the y/y gain to 8.6%, its strongest since late 2006. Growth in inventories within the transportation sector has been strong at 14.6% y/y. [...]
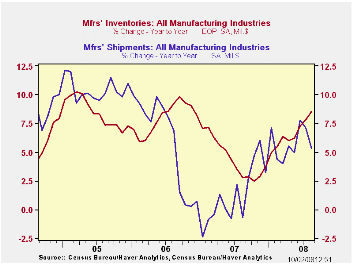
Factory inventories increased another 0.6% during August, the same as during July. That lifted the y/y gain to 8.6%, its strongest since late 2006. Growth in inventories within the transportation sector has been strong at 14.6% y/y. Yet less the transportation sector inventory growth similarly was firm. The y/y gain of 7.5% was the strongest since late 2006.
Inventories of transportation equipment has been notable at 14.6% y/y led by a 32.6% bulge in inventories of nondefense aircraft & parts. Defense aircraft inventories also were strong and posted a 12.9% jump. Automobile inventories fell 6.0% y/y and light truck inventories were off 15.4%. Growth in inventories of primary metals also has been notable at 11.9% y/y while fabricated metals inventories rose 8.0%. Electrical equipment & appliance inventories grew a stable 5.4% while growth in machinery inventories also was stable at 6.4%.
Total factory orders fell 4.0% during August versus expectations for a 2.4% drop. The decline reflected the already reported 4.8% shortfall in durable goods orders. They were pulled lower by a 9.1% decline in new orders for transportation equipment.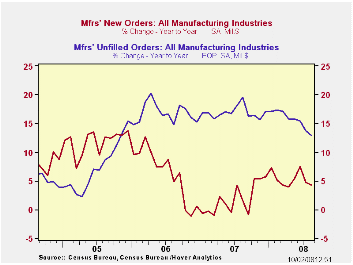
Factory shipments similarly dropped 3.5%, led by an 8.0% (-15.5% y/y) drop in transportation sector shipments. Shipments of electrical equipment also were weak and they posted a 4.6% (-1.2% y/y) decline. Electronic computer shipments fell 3.3% (-11.8% y/y) as did shipments of furniture & related products (-6.4% y/y). Shipments from petroleum refineries were weak last month and posted a 9.1% drop with lower prices. Year-to-year, however, they were still up 49.6%.
Overall unfilled orders rose 0.4% and 12.9% y/y. Much of the strength over the last year has been due to the 24.5% gain in order backlogs of nondefense aircraft & parts. Order backlogs for electronic computers fell slightly but order backlogs of machinery surged (23.2% y/y).
The latest Business Outlook Survey from the Federal Reserve Bank of Philadelphia is available here.
| Factory Survey (NAICS, %) | August | July | Y/Y | 2007 | 2006 | 2005 |
|---|---|---|---|---|---|---|
| Inventories | 0.6 | 0.6 | 8.6 | 3.7 | 6.4 | 8.9 |
| Excluding Transportation | 0.6 | 0.5 | 7.5 | 2.7 | 7.9 | 8.1 |
| New Orders | -4.0 | 0.7 | 4.2 | 1.9 | 6.2 | 11.9 |
| Excluding Transportation | -3.3 | 0.5 | 8.4 | 1.2 | 7.4 | 11.7 |
| Shipments | -3.5 | 1.4 | 5.3 | 1.2 | 5.9 | 10.4 |
| Excluding Transportation | -2.9 | 1.3 | 8.7 | 1.5 | 6.7 | 11.4 |
| Unfilled Orders | 0.4 | 0.8 | 12.9 | 17.1 | 15.3 | 15.4 |
| Excluding Transportation | 0.2 | 0.9 | 9.3 | 8.2 | 16.0 | 9.2 |

Tom Moeller
AuthorMore in Author Profile »Prior to joining Haver Analytics in 2000, Mr. Moeller worked as the Economist at Chancellor Capital Management from 1985 to 1999. There, he developed comprehensive economic forecasts and interpreted economic data for equity and fixed income portfolio managers. Also at Chancellor, Mr. Moeller worked as an equity analyst and was responsible for researching and rating companies in the economically sensitive automobile and housing industries for investment in Chancellor’s equity portfolio. Prior to joining Chancellor, Mr. Moeller was an Economist at Citibank from 1979 to 1984. He also analyzed pricing behavior in the metals industry for the Council on Wage and Price Stability in Washington, D.C. In 1999, Mr. Moeller received the award for most accurate forecast from the Forecasters' Club of New York. From 1990 to 1992 he was President of the New York Association for Business Economists. Mr. Moeller earned an M.B.A. in Finance from Fordham University, where he graduated in 1987. He holds a Bachelor of Arts in Economics from George Washington University.
More Economy in Brief


