 Global| Nov 02 2006
U.S. Factory Inventory Accumulation Continued
by:Tom Moeller
|in:Economy in Brief
Summary
Factory inventories rose 0.6% last month. That matched the gain during July, which was upwardly revised, and it pulled the y/y change up to 7.4%, the fastest since early 2005. Though petroleum inventories have fallen in recent months, [...]
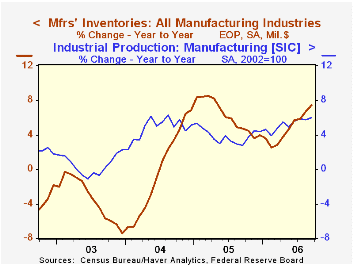
Factory inventories rose 0.6% last month. That matched the gain during July, which was upwardly revised, and it pulled the y/y change up to 7.4%, the fastest since early 2005.
Though petroleum inventories have fallen in recent months, higher prices have lifted the y/y gain to 15.7%. Despite this distortion, factory inventories less petroleum grew 7.0% y/y in September, the fastest since 2005.
Primary metals inventories rose another, firm 2.8% (16.3% y/y). Inventories of computers & electronic products actually fell slightly (9.3% y/y) after a strong 1.5% August increase and inventories of electrical equipment fell 0.3% (+11.6% y/y) after near 2% jumps during each of the prior three months. Machinery inventories spiked 1.4% (6.1% y/y).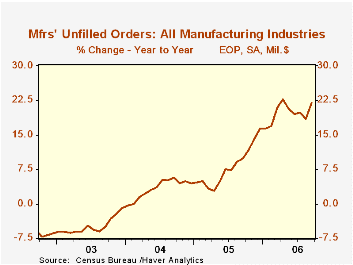
Total factory orders recovered a strong 2.1% after an August dip. That strength reflected an 8.3% pop in durable goods orders which was little revised from the advance report and reflected higher aircraft orders. Factory orders less transportation fell 2.4% (+3.0% y/y), the weakness reflecting a 4.6% decline in nondurables and a 14.8% drop in petroleum.
Factory shipments fell 3.5% due to the drop in petroleum. Transportation shipments also collapsed 4.5% due to a 7.3% drop in autos. Still, factory shipments less transportation & petroleum fell 2.0% (+5.0% y/y) due to across the board declines.
Unfilled orders surged 3.9% due to the jump in civilian aircraft. Less the transportation sector altogether backlogs rose 1.2% (13.1% y/y).
| Factory Survey (NAICS) | September | August | Y/Y | 2005 | 2004 | 2003 |
|---|---|---|---|---|---|---|
| Inventories | 0.6% | 0.6% | 7.4% | 4.0% | 6.9% | -7.4% |
| New Orders | 2.1% | -0.3% | 7.7% | 8.5% | 7.5% | 0.9% |
| Shipments | -3.5% | 0.8% | 2.4% | 7.1% | 6.8% | 0.2% |
| Unfilled Orders | 3.9% | 0.5% | 22.0% | 16.3% | 4.5% | -1.0% |

Tom Moeller
AuthorMore in Author Profile »Prior to joining Haver Analytics in 2000, Mr. Moeller worked as the Economist at Chancellor Capital Management from 1985 to 1999. There, he developed comprehensive economic forecasts and interpreted economic data for equity and fixed income portfolio managers. Also at Chancellor, Mr. Moeller worked as an equity analyst and was responsible for researching and rating companies in the economically sensitive automobile and housing industries for investment in Chancellor’s equity portfolio. Prior to joining Chancellor, Mr. Moeller was an Economist at Citibank from 1979 to 1984. He also analyzed pricing behavior in the metals industry for the Council on Wage and Price Stability in Washington, D.C. In 1999, Mr. Moeller received the award for most accurate forecast from the Forecasters' Club of New York. From 1990 to 1992 he was President of the New York Association for Business Economists. Mr. Moeller earned an M.B.A. in Finance from Fordham University, where he graduated in 1987. He holds a Bachelor of Arts in Economics from George Washington University.
More Economy in Brief


