 Global| Jan 04 2010
U.S. Factory Inventories &Shipments Increase Again
by:Tom Moeller
|in:Economy in Brief
Summary
Though its rate of decline has moderated, construction spending has continued to move lower. During November construction outlays fell 0.6% after a little-revised 0.5% October shortfall. The latest decline left the y/y change at [...]
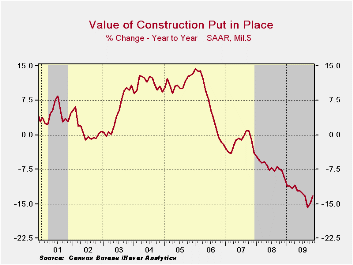 Though its
rate of decline has moderated, construction spending has continued to
move lower. During November construction outlays fell 0.6% after a
little-revised 0.5% October shortfall. The latest decline left the y/y
change at -13.2% which was improved just modestly from the weakest
-15.8% September comparison. The latest decline about matched Consensus
estimates.
Though its
rate of decline has moderated, construction spending has continued to
move lower. During November construction outlays fell 0.6% after a
little-revised 0.5% October shortfall. The latest decline left the y/y
change at -13.2% which was improved just modestly from the weakest
-15.8% September comparison. The latest decline about matched Consensus
estimates.
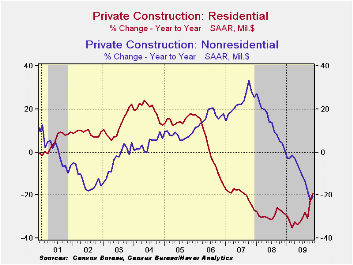
Residential building activity renewed its decline with a 1.6% fall following a 4.8% October gain. The decline owed to a 4.1% (-44.4% y/y) drop in multi-family building and a 3.9% (-2.8% y/y) shortfall in spending on improvements. Single-family construction rose 1.3% (-25.2% y/y) for the sixth consecutive monthly increase.
Nonresidential building activity was roughly unchanged after a steep 4.8% October decline. Since the 2008 peak, activity has fallen by 22.5%. Spending in the food & beverage industry declined 44.1% y/y while expenditures in the lodging were off by nearly one-half. Commercial building overall fell 40.5% y/y while office building dropped by more than one-third. Relatively moderate were the declines in the education (-18.8% y/y), religious (-18.3% y/y) and health care (-16.1% y/y) sectors. Factory sector spending (-7.0% y/y) was buoyed by gains in the chemical and in the computer/electronic/electrical sectors.
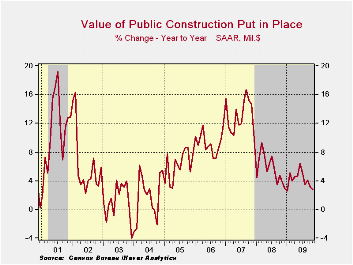
In the public sector, construction overall fell a modest 0.4% during November but y/y expenditures rose despite lower tax revenues. Building activity on highways & streets fell 2.9% m/m but rose 5.7% y/y due to the focus on infrastructure rebuilding. Public spending on health care facilities increased a strong 12.2% y/y but building in the education sector was off 2.6% y/y.
The construction put-in-place figures are available in Haver's USECON database.
| Construction (%) | November | October | September | Y/Y | 2008 | 2007 | 2006 |
|---|---|---|---|---|---|---|---|
| Total | -0.6 | -0.5 | -1.6 | -13.2 | -6.9 | -1.6 | 6.3 |
| Private | -0.7 | -0.8 | -2.4 | -20.0 | -11.1 | -5.7 | 5.5 |
| Residential | -1.6 | 4.8 | -0.6 | -19.2 | -29.1 | -19.7 | 1.0 |
| Nonresidential | -0.0 | -4.8 | -3.7 | -20.6 | 13.2 | 23.1 | 16.2 |
| Public | -0.4 | 0.0 | -0.1 | 2.7 | 5.6 | 13.1 | 9.3 |

Tom Moeller
AuthorMore in Author Profile »Prior to joining Haver Analytics in 2000, Mr. Moeller worked as the Economist at Chancellor Capital Management from 1985 to 1999. There, he developed comprehensive economic forecasts and interpreted economic data for equity and fixed income portfolio managers. Also at Chancellor, Mr. Moeller worked as an equity analyst and was responsible for researching and rating companies in the economically sensitive automobile and housing industries for investment in Chancellor’s equity portfolio. Prior to joining Chancellor, Mr. Moeller was an Economist at Citibank from 1979 to 1984. He also analyzed pricing behavior in the metals industry for the Council on Wage and Price Stability in Washington, D.C. In 1999, Mr. Moeller received the award for most accurate forecast from the Forecasters' Club of New York. From 1990 to 1992 he was President of the New York Association for Business Economists. Mr. Moeller earned an M.B.A. in Finance from Fordham University, where he graduated in 1987. He holds a Bachelor of Arts in Economics from George Washington University.
More Economy in Brief


