 Global| May 03 2005
U.S. Factory Inventories Rose
by:Tom Moeller
|in:Economy in Brief
Summary
Factory inventories rose 0.6% in March following an upwardly revised like increase in February. Higher oil prices recently have lifted these gains, but not a lot, as petroleum refinery inventories rose 3.2% (22.4% y/y). Less [...]
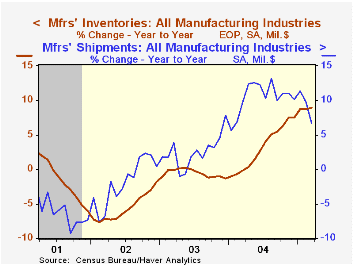
Factory inventories rose 0.6% in March following an upwardly revised like increase in February. Higher oil prices recently have lifted these gains, but not a lot, as petroleum refinery inventories rose 3.2% (22.4% y/y). Less petroleum, inventories rose 0.5% (8.4% y/y).
Accumulation in the primary metals industry has been notable, up 30.3% y/y, and fabricated metal inventories also rose a strong 17.3% y/y. Machinery inventorieshave risen 11.1% this past year and electrical equipment inventories are up 7.9%. Inventories of furniture & related products rose 12.2% y/y while inventories of apparel rose 7.5% y/y.
Factory shipments recovered nearly all of the prior month's drop with a 1.3% gain. Less transportation, shipments rose 1.6% (9.2% y/y) following a deepened 1.2% decline in February.
Orders to the factory sector ticked up 0.1%, restrained by a 2.3% decline in durable goods orders which was revised from the advance report of a 2.8% drop. The decline in orders for non-defense capital goods less aircraft was lessened to 4.0% (+2.7% y/y) from the advance report of a 4.7% shortfall.Nondurable goods orders, which equal shipments, rose 2.8% (10.4% y/y) led by a 19.8% (42.2% y/y) surge in petroleum. Less oil, orders for non-durables fell 0.4% (+5.5% y/y) for the second monthly drop.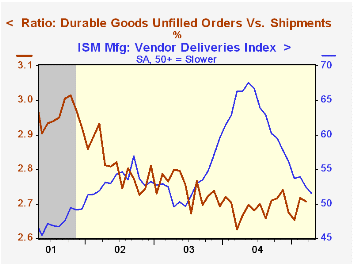
Unfilled orders fell 0.3% and lowered the ratio of unfilled orders to shipments for durables slightly.
Do Technological Improvements in the Manufacturing Sector Raise or Lower Employment? from the Federal Reserve Bank of Philadelphia can be found here.
| Factory Survey (NAICS) | Mar | Feb | Y/Y | 2004 | 2003 | 2002 |
|---|---|---|---|---|---|---|
| Inventories | 0.6% | 0.6% | 8.9% | 7.5% | -1.3% | -1.8% |
| New Orders | 0.1% | -0.5% | 4.1% | 10.9% | 3.7% | -1.9% |
| Shipments | 1.3% | -1.5% | 6.7% | 10.5% | 2.6% | -2.0% |
| Unfilled Orders | -0.3% | 0.5% | 6.8% | 9.1% | 4.2% | -6.1% |

Tom Moeller
AuthorMore in Author Profile »Prior to joining Haver Analytics in 2000, Mr. Moeller worked as the Economist at Chancellor Capital Management from 1985 to 1999. There, he developed comprehensive economic forecasts and interpreted economic data for equity and fixed income portfolio managers. Also at Chancellor, Mr. Moeller worked as an equity analyst and was responsible for researching and rating companies in the economically sensitive automobile and housing industries for investment in Chancellor’s equity portfolio. Prior to joining Chancellor, Mr. Moeller was an Economist at Citibank from 1979 to 1984. He also analyzed pricing behavior in the metals industry for the Council on Wage and Price Stability in Washington, D.C. In 1999, Mr. Moeller received the award for most accurate forecast from the Forecasters' Club of New York. From 1990 to 1992 he was President of the New York Association for Business Economists. Mr. Moeller earned an M.B.A. in Finance from Fordham University, where he graduated in 1987. He holds a Bachelor of Arts in Economics from George Washington University.
More Economy in Brief


