 Global| Dec 04 2008
U.S. Factory Inventories Fell Again
by:Tom Moeller
|in:Economy in Brief
Summary
Factory inventories dropped again in October. The 0.6% m/m decline followed a 0.8% slide during the month prior. They were the first back-to-back monthly declines since 2003. Inventories in the transportation sector have been rising [...]
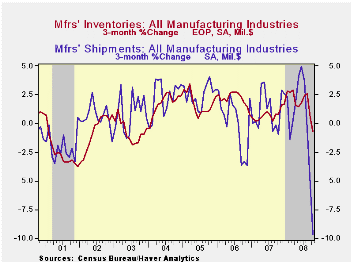
Factory inventories dropped again in October. The 0.6% m/m decline followed a 0.8% slide during the month prior. They were the first back-to-back monthly declines since 2003. Inventories in the transportation sector have been rising as production cutbacks have not kept pace with lower demand. Less the transportation sector, inventories fell 1.0% after a 0.9% September decline.
Inventories of transportation equipment rose 1.6% (15.1% y/y) due to the 1.8% backup in automobile inventories (0.7% y/y) which followed a 2.6% September jump. Light truck inventories also rose 1.6% but they were off by nearly one quarter from last October. Growth in inventories of commercial aircraft continued to dominate the figures, however, and they rose 2.8% during October and they're up by more than one-third y/y. Electrical equipment & appliance inventories fell 0.7% and reversed a like increase during September (+5.1% y/y) while machinery inventories rose a firm 0.2% (5.5% y/y).
Total factory orders fell 5.1% during October which was larger than Consensus expectations for a 3.9% drop. The decline reflected a 6.9% plummet in durable goods orders which was a slightly steeper decline than indicated in the advance report. Orders were pulled lower by an 11.2% decline in new orders for transportation equipment.
Factory shipments dropped 3.2%, about the same as reported for September. Shipments of transportation equipment fell 5.2% as commercial aircraft shipments plunged 10.1% (-22.1% y/y). Shipments of electrical equipment also were weak and they posted a 4.6% (-1.2% y/y) decline. Electronic computer shipments fell for the third straight month (-1.8% y/y) and shipments of furniture & related products fell an even harder 4.1% (-11.3% y/y). Shipments from petroleum refineries were quite weak last month (-13.0%) as oil prices fell and they are off 4.1% y/y.
| Factory Survey (NAICS, %) | October | September | Y/Y | 2007 | 2006 | 2005 |
|---|---|---|---|---|---|---|
| Inventories | -0.6 | -0.8 | 6.2 | 3.7 | 6.4 | 8.9 |
| Excluding Transportation | -1.0 | -0.9 | 4.6 | 2.7 | 7.9 | 8.1 |
| New Orders | -5.1 | -3.1 | -5.3 | 1.9 | 6.2 | 11.9 |
| Excluding Transportation | -4.2 | -4.3 | -2.5 | 1.2 | 7.4 | 11.7 |
| Shipments | -3.2 | -3.1 | -2.3 | 1.2 | 5.9 | 10.4 |
| Excluding Transportation | -2.9 | -3.8 | -0.3 | 1.5 | 6.7 | 11.4 |
| Unfilled Orders | -0.6 | 0.2 | 10.0 | 17.1 | 15.3 | 15.4 |
| Excluding Transportation | -1.6 | -0.6 | 5.2 | 8.2 | 16.0 | 9.2 |

Tom Moeller
AuthorMore in Author Profile »Prior to joining Haver Analytics in 2000, Mr. Moeller worked as the Economist at Chancellor Capital Management from 1985 to 1999. There, he developed comprehensive economic forecasts and interpreted economic data for equity and fixed income portfolio managers. Also at Chancellor, Mr. Moeller worked as an equity analyst and was responsible for researching and rating companies in the economically sensitive automobile and housing industries for investment in Chancellor’s equity portfolio. Prior to joining Chancellor, Mr. Moeller was an Economist at Citibank from 1979 to 1984. He also analyzed pricing behavior in the metals industry for the Council on Wage and Price Stability in Washington, D.C. In 1999, Mr. Moeller received the award for most accurate forecast from the Forecasters' Club of New York. From 1990 to 1992 he was President of the New York Association for Business Economists. Mr. Moeller earned an M.B.A. in Finance from Fordham University, where he graduated in 1987. He holds a Bachelor of Arts in Economics from George Washington University.
More Economy in Brief


