 Global| Apr 23 2009
U.S. Existing Home Sales Slip During March As Prices Firm
by:Tom Moeller
|in:Economy in Brief
Summary
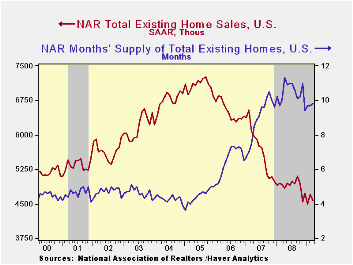
The lower price-higher sales story from the housing market seemed to reverse last month, according to the National Association of Realtors. Sales of existing homes fell 3.0% last month to 4.57M and that reversed most of February' 4.9% [...]
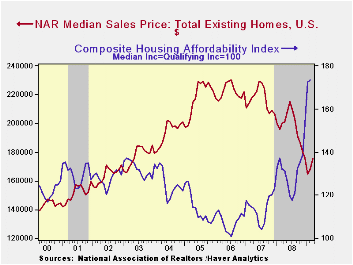
Working the other way were median home prices which rose 4.2% after an upwardly revised 2.1% increase. These gains may reflect, however, the end of the winter doldrums. Prices have fallen 23.5% since their peak. Declines in home prices and lower interest rates have gone a long way to increase the affordability of an existing home which is up roughly one-quarter from one year ago. The measure rose in February to a record high for the series which dates back to 1971.
Sales of existing single-family homes alone also reversed most of the earlier month's gain with a 2.8% m/m decline to 4.100M units. Sales remained near the lowest level since July 1997 and they have been essentially flat for the last four months. (These data have a longer history than the total series).
The number of unsold homes (condos & single-family) on the market reversed a portion of their February increase with a 1.6% decline. Year-to-year inventories are down 9.3%. At the current sales rate there was a 9.8 months' supply on the market which was near the lowest since 2007. For single-family homes the inventory also fell slightly by 1.2% (-9.7% y/y). At the current sales rate there was a 9.3 month's supply, near the lowest since 2007.
The data on existing home sales, prices and affordability can be found in Haver's USECON database. The regional price, affordability and inventory data is available in the REALTOR database.
Global Economy Contracts, With Slow Recovery Next Year from the International Monetary Fund can be found here.
| Existing Home Sales (Thous) | March | February | March y/y % | March '08 | 2008 | 2007 | 2006 |
|---|---|---|---|---|---|---|---|
| Total | 4,570 | 4,710 | -7.1 | 4,920 | 4,893 | 5,674 | 6,516 |
| Northeast | 690 | 750 | -22.5 | 890 | 845 | 1,010 | 1,093 |
| Midwest | 1,040 | 1,040 | -11.1 | 1,170 | 1,130 | 1,331 | 1,494 |
| South | 1,710 | 1,740 | -10.9 | 1,920 | 1,860 | 2,243 | 2,577 |
| West | 1,130 | 1,180 | 18.9 | 950 | 1,064 | 1,095 | 1,357 |
| Single-Family | 4,100 | 4,220 | -5.7 | 4,350 | 4,341 | 4,960 | 5,712 |
| Median Price, Total, $ | 175,200 | 168,200 | -12.4 | 200,100 | 197,250 | 216,633 | 222,042 |

Tom Moeller
AuthorMore in Author Profile »Prior to joining Haver Analytics in 2000, Mr. Moeller worked as the Economist at Chancellor Capital Management from 1985 to 1999. There, he developed comprehensive economic forecasts and interpreted economic data for equity and fixed income portfolio managers. Also at Chancellor, Mr. Moeller worked as an equity analyst and was responsible for researching and rating companies in the economically sensitive automobile and housing industries for investment in Chancellor’s equity portfolio. Prior to joining Chancellor, Mr. Moeller was an Economist at Citibank from 1979 to 1984. He also analyzed pricing behavior in the metals industry for the Council on Wage and Price Stability in Washington, D.C. In 1999, Mr. Moeller received the award for most accurate forecast from the Forecasters' Club of New York. From 1990 to 1992 he was President of the New York Association for Business Economists. Mr. Moeller earned an M.B.A. in Finance from Fordham University, where he graduated in 1987. He holds a Bachelor of Arts in Economics from George Washington University.
More Economy in Brief


