 Global| May 27 2009
U.S. Existing Home Sales Rise As Home Affordability Increases
by:Tom Moeller
|in:Economy in Brief
Summary
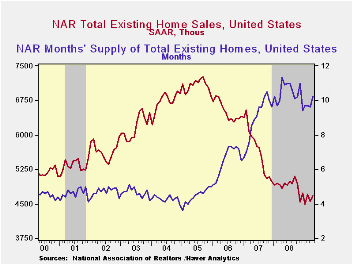
Both home sales and home prices rose slightly last month, according to the National Association of Realtors. The overriding message, however, was that lower prices can spur sales. Sales of existing homes rose 2.9% last month to 4.68M [...]
The price part of the story was provided by the indication that although home prices rose all of 0.2% during April, they were down 15.4% y/y. Moreover, home prices were down by one-quarter from the 2007 peak. These declines in home prices and lower interest rates have gone a long way to increase the affordability of an existing home which is up roughly one-quarter from one year ago and by more than one-half from 2007. The measure fell slightly in the latest two months and the series dates back to 1971.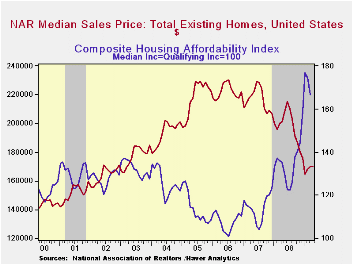
Sales of existing single-family homes alone also reversed most of the March decline with a 2.5% m/m increase to 4.180M units. However, sales remained near the lowest level since July 1997 as they have been essentially flat for the last six months. (These data have a longer history than the total series).
The number of unsold homes (condos & single-family) on the market increased a sharp 8.8% last month but year-to-year inventories are down 12.8%. At the current sales rate there was a 10.2 months' supply on the market which was near the lowest since 2007. For single-family homes the inventory rose a sharp 9.2% during April but it remained low versus last year's high. At the current sales rate there was a 9.6 month's supply, near the lowest since 2007.
The data on existing home sales, prices and affordability can be found in Haver's USECON database. The regional price, affordability and inventory data is available in the REALTOR database.
The Impact of Inflation and Unemployment on Subjective Personal and Country Evaluations from the Federal Reserve Bank of St. Louis can be found here.
| Existing Home Sales (Thous) | April | March | April y/y % | April '08 | 2008 | 2007 | 2006 |
|---|---|---|---|---|---|---|---|
| Total | 4,570 | 4,710 | -7.1 | 4,920 | 4,893 | 5,674 | 6,516 |
| Northeast | 770 | 690 | -10.5 | 860 | 845 | 1,010 | 1,093 |
| Midwest | 1,000 | 1,020 | -9.9 | 1,110 | 1,130 | 1,331 | 1,494 |
| South | 1,740 | 1,710 | -8.9 | 1,910 | 1,860 | 2,243 | 2,577 |
| West | 1,170 | 1,130 | 19.4 | 980 | 1,064 | 1,095 | 1,357 |
| Single-Family | 4,180 | 4,080 | -2.8 | 4,300 | 4,341 | 4,960 | 5,712 |
| Median Price, Total, $ | 170,200 | 169,900 | -15.4 | 201,300 | 197,250 | 216,633 | 222,042 |

Tom Moeller
AuthorMore in Author Profile »Prior to joining Haver Analytics in 2000, Mr. Moeller worked as the Economist at Chancellor Capital Management from 1985 to 1999. There, he developed comprehensive economic forecasts and interpreted economic data for equity and fixed income portfolio managers. Also at Chancellor, Mr. Moeller worked as an equity analyst and was responsible for researching and rating companies in the economically sensitive automobile and housing industries for investment in Chancellor’s equity portfolio. Prior to joining Chancellor, Mr. Moeller was an Economist at Citibank from 1979 to 1984. He also analyzed pricing behavior in the metals industry for the Council on Wage and Price Stability in Washington, D.C. In 1999, Mr. Moeller received the award for most accurate forecast from the Forecasters' Club of New York. From 1990 to 1992 he was President of the New York Association for Business Economists. Mr. Moeller earned an M.B.A. in Finance from Fordham University, where he graduated in 1987. He holds a Bachelor of Arts in Economics from George Washington University.
More Economy in Brief


