 Global| Nov 23 2004
U.S. Existing Home Sales Remained High
by:Tom Moeller
|in:Economy in Brief
Summary
Sales of existing single family homes held the high ground with a 0.1% (+5.6% y/y) slip in October to 6.75M. September sales were revised up slightly and Consensus expectations had been for sales of 6.72M. The figures reflect closings [...]
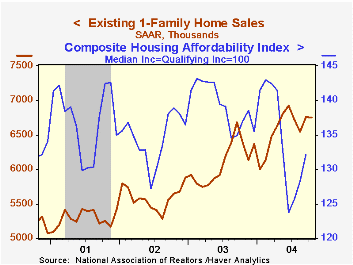
Sales of existing single family homes held the high ground with a 0.1% (+5.6% y/y) slip in October to 6.75M. September sales were revised up slightly and Consensus expectations had been for sales of 6.72M.
The figures reflect closings of home sales in earlier months.
Sales fell moderately in most areas of the country except in the South where they rose (+7.4% y/y) to a record high.
The median price of an existing home rose slightly to $187,000 (+8.8% y/y) following three months of decline.
| Existing Home Sales (000, AR) | Oct | Sept | Y/Y | 2003 | 2002 | 2001 |
|---|---|---|---|---|---|---|
| Existing Single-Family | 6,750 | 6,760 | 5.6% | 6,098 | 5,593 | 5,290 |
by Tom Moeller November 23, 2004
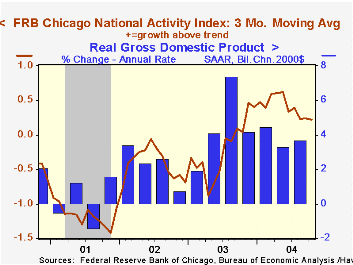
The Chicago Fed National Activity Index (CFNAI) for October rose to 0.52 but the prior month's negative reading was deepened slightly. The three-month moving average of the CFNAI fell to the lowest level in nearly a year.
A zero value of the CFNAI indicates that the economy is expanding at its historical trend rate of growth.
During the last twenty years there has been a 74% correlation between the level of the CFNAI and q/q growth in real GDP.
The CFNAI is a weighted average of 85 indicators of economic activity. The indicators reflect activity in the following categories: production and income, the labor market, personal consumption and housing, manufacturing and trade sales, and inventories & orders.
| Chicago Fed | Oct | Sept | Oct '03 | 2003 | 2002 | 2001 |
|---|---|---|---|---|---|---|
| CFNAI | 0.52 | -0.04 | 0.19 | -0.11 | -0.40 | -1.19 |
by Tom Moeller November 23, 2004
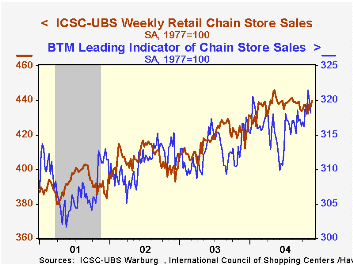
Last week, chain store sales recovered 0.8% following the prior week's 0.4% dip, according to the International Council of Shopping Centers (ICSC)-UBS.
Sales so far in November are 0.7% ahead of October.
Not so positive was the second consecutive 0.5% weekly decline in the leading indicator of chain store sales from ICSC. The monthly average is up just 0.2% from October which rose 0.4% from September.
During the last ten years there has been a 60% correlation between y/y change in chain store sales and the change in non-auto retail sales less gasoline.
The ICSC-UBS retail chain-store sales index is constructed using the same-store sales reported by 78 stores of seven retailers: Dayton Hudson, Federated, Kmart, May, J.C. Penney, Sears and Wal-Mart.
This 2001 report from the Federal Reserve Bank of New York examines "The Effect of Tax Changes on Consumer Spending".
| ICSC-UBS (SA, 1977=100) | 11/20/04 | 11/13/04 | Y/Y | 2003 | 2002 | 2001 |
|---|---|---|---|---|---|---|
| Total Weekly Chain Store Sales | 439.6 | 436.1 | 3.9% | 2.9% | 3.6% | 2.1% |

Tom Moeller
AuthorMore in Author Profile »Prior to joining Haver Analytics in 2000, Mr. Moeller worked as the Economist at Chancellor Capital Management from 1985 to 1999. There, he developed comprehensive economic forecasts and interpreted economic data for equity and fixed income portfolio managers. Also at Chancellor, Mr. Moeller worked as an equity analyst and was responsible for researching and rating companies in the economically sensitive automobile and housing industries for investment in Chancellor’s equity portfolio. Prior to joining Chancellor, Mr. Moeller was an Economist at Citibank from 1979 to 1984. He also analyzed pricing behavior in the metals industry for the Council on Wage and Price Stability in Washington, D.C. In 1999, Mr. Moeller received the award for most accurate forecast from the Forecasters' Club of New York. From 1990 to 1992 he was President of the New York Association for Business Economists. Mr. Moeller earned an M.B.A. in Finance from Fordham University, where he graduated in 1987. He holds a Bachelor of Arts in Economics from George Washington University.
More Economy in Brief


