 Global| Feb 26 2010
U.S. Existing Home Sales Plummet As Prices Fall Sharply
by:Tom Moeller
|in:Economy in Brief
Summary
The National Association of Realtors reported that January sales of existing homes fell another 7.2% to 5.050M units (SAAR) after a little-revised 16.2% December decline. The decline may have been again influenced by the timing of a [...]
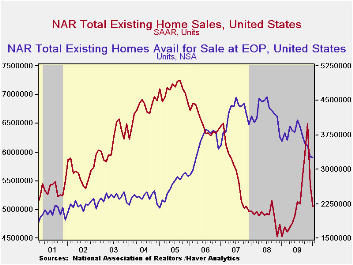 The National
Association of Realtors reported that January sales of
existing homes fell another 7.2% to 5.050M units (SAAR) after
a little-revised 16.2% December decline. The decline may have been
again influenced by the timing of a recently-extended home-buyer tax
credit. The fall in January home sales greatly exceeded Consensus
expectations for a decline to 5.90M.
The National
Association of Realtors reported that January sales of
existing homes fell another 7.2% to 5.050M units (SAAR) after
a little-revised 16.2% December decline. The decline may have been
again influenced by the timing of a recently-extended home-buyer tax
credit. The fall in January home sales greatly exceeded Consensus
expectations for a decline to 5.90M.
The home-buyer tax credit of up to $8,000 now runs though April 30. Additionally, a new credit of up to $6,500 is available to some existing home owners who move. The full details of the home-buyer tax credit can be found here.
Sales of single-family homes fell 6.9% but they remained up 8.6% y/y as
home affordability improved with lower prices and low interest rates.
Sales 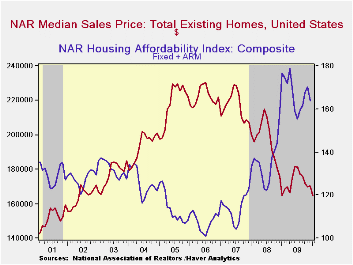 of condos and co-ops alone fell 8.1% from December to 620,000 but
were up by one-third from twelve months ago.
of condos and co-ops alone fell 8.1% from December to 620,000 but
were up by one-third from twelve months ago.
The median price of all existing homes fell 3.4% last month after a much-reduced 0.3% December rise. The latest level equaled that of 12 months ago and these were the lowest since May 2002. Some comfort may be taken from the unchanged level of prices versus one year ago versus the 2.4%-to-12.4% declines during the last three years. These declines have raised the affordability of a home to near its record high although the rate of increase has slowed sharply.
The number of unsold homes (single-family & co-ops) fell 0.5% in January (-9.6% y/y) to the lowest level since March 2006. At the current sales rate there was a slightly-increased 7.8 months' supply of homes on the market, near the lowest since late 2006. The latest figure was down from a high of 11.3 months during April of 2008. For single-family homes, the inventory rose to a 7.6 months' supply.
The data on existing home sales, prices and affordability can be found in Haver's USECON database. The regional price, affordability and inventory data is available in the REALTOR database.
| Existing Home Sales (Thous, SAAR) | January | December | November | Y/Y | 2009 | 2008 | 2007 |
|---|---|---|---|---|---|---|---|
| Total | 5,050 | 5,440 | 6,590 | 11.5% | 5,160 | 4,893 | 5,675 |
| Northeast | 820 | 920 | 1,150 | -22.4 | 863 | 847 | 1,009 |
| Midwest | 1,080 | 1,160 | 1,540 | 8.0 | 1,166 | 1,125 | 1,329 |
| South | 1,870 | 2,020 | 2,380 | -12.0 | 1,913 | 1,858 | 2,244 |
| West | 1,280 | 1,350 | 1,420 | 7.6 | 1,216 | 1,063 | 1,093 |
| Single-Family | 4,430 | 4,760 | 5,710 | 8.6 | 4,567 | 4,338 | 4,959 |
| Median Price, Total, $ (NSA) | 164,700 | 170,500 | 170,000 | 0.0 | 172,742 | 197,233 | 216,633 |

Tom Moeller
AuthorMore in Author Profile »Prior to joining Haver Analytics in 2000, Mr. Moeller worked as the Economist at Chancellor Capital Management from 1985 to 1999. There, he developed comprehensive economic forecasts and interpreted economic data for equity and fixed income portfolio managers. Also at Chancellor, Mr. Moeller worked as an equity analyst and was responsible for researching and rating companies in the economically sensitive automobile and housing industries for investment in Chancellor’s equity portfolio. Prior to joining Chancellor, Mr. Moeller was an Economist at Citibank from 1979 to 1984. He also analyzed pricing behavior in the metals industry for the Council on Wage and Price Stability in Washington, D.C. In 1999, Mr. Moeller received the award for most accurate forecast from the Forecasters' Club of New York. From 1990 to 1992 he was President of the New York Association for Business Economists. Mr. Moeller earned an M.B.A. in Finance from Fordham University, where he graduated in 1987. He holds a Bachelor of Arts in Economics from George Washington University.


