 Global| Oct 01 2019
U.S. Energy Product Prices Decline
by:Tom Moeller
|in:Economy in Brief
Summary
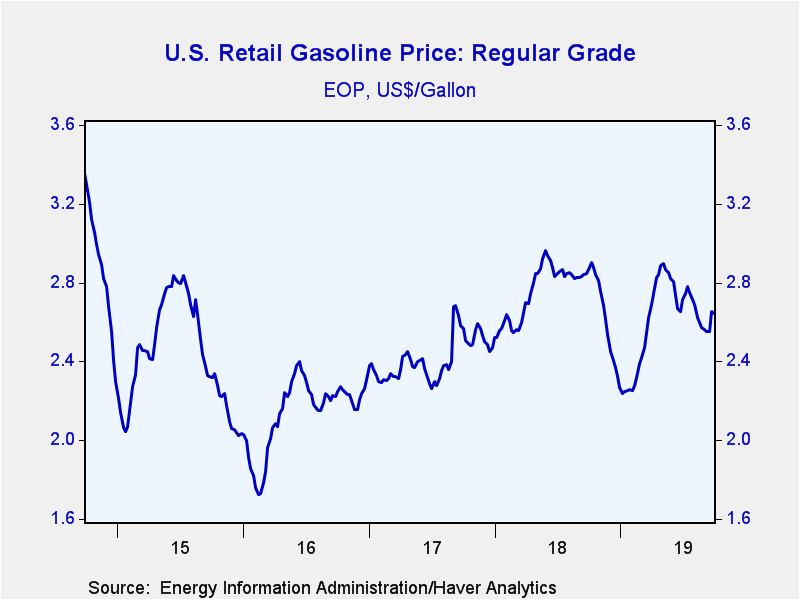
In the week ended September 30, the U.S. pump price for gasoline of $2.64 per gallon (-7.8% y/y) compared to $2.65 during the prior week. These were the highest prices since early-August. Haver Analytics adjusts these price figures [...]
In the week ended September 30, the U.S. pump price for gasoline of $2.64 per gallon (-7.8% y/y) compared to $2.65 during the prior week. These were the highest prices since early-August. Haver Analytics adjusts these price figures for seasonal variation. The seasonally adjusted price increase of $2.54 per gallon compared to $2.55 in the previous week.
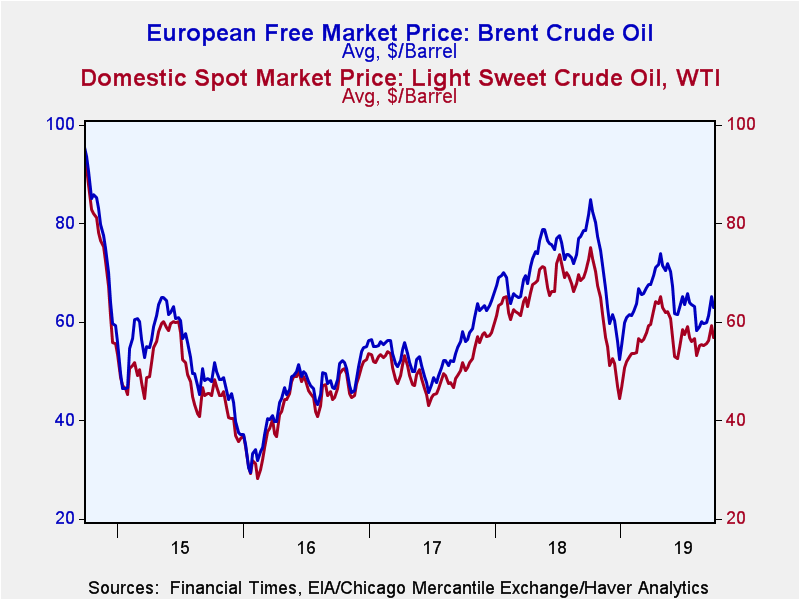
The price of West Texas Intermediate crude oil fell to $56.94 per barrel (-21.7% y/y) last week following a rise to $59.30 per barrel two weeks ago. Yesterday, the price was $54.07 per barrel. The price of Brent crude oil fell to $62.92 per barrel (-23.0% y/y) after rising to an average $65.13 during the prior week. Yesterday, the price was $59.35.
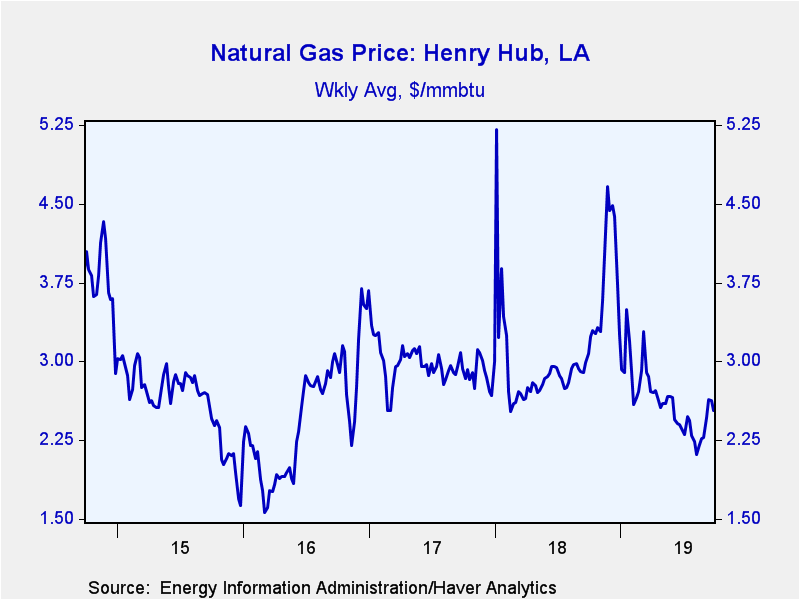
The price of natural gas fell to $2.53 per mmbtu (-17.5% y/y) in the week ended September 27 from $2.63/mmbtu. The price remained higher than the low of $2.11 averaged in the second week of August. Yesterday the price was $2.37.
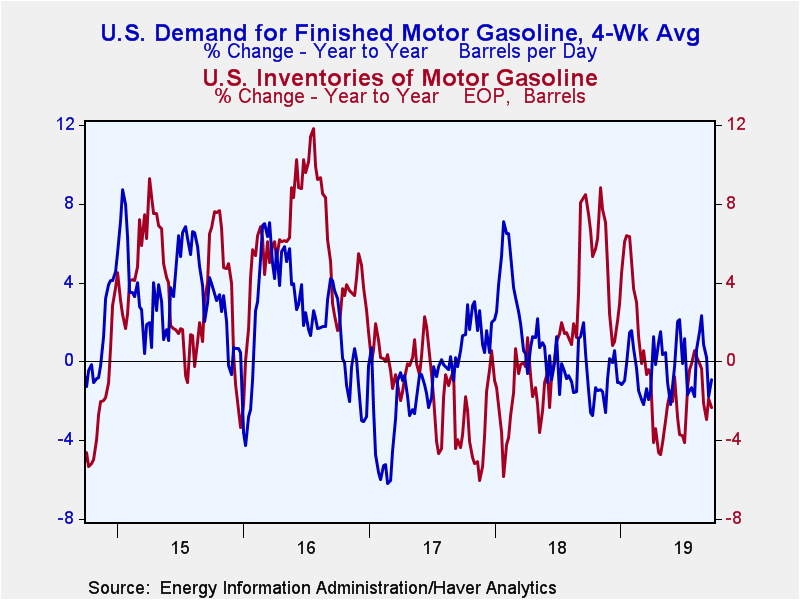
For the four weeks ending September 20, U.S. gasoline demand slipped 0.9% y/y. Total petroleum product demand increased 1.4% y/y. U.S. gasoline inventories fell 2.3% y/y while inventories of all petroleum products increased 2.2% y/y. Crude oil input to U.S. refineries fell 1.9% y/y.
These data are reported by the U.S. Department of Energy. The price data can be found in Haver's WEEKLY and DAILY databases. More detail on prices, demand, production and inventories, including regional breakdowns, are in OILWKLY.
| Weekly Energy Prices | 9/30/19 | 9/23/19 | 9/16/19 | Y/Y % | 2018 | 2017 | 2016 |
|---|---|---|---|---|---|---|---|
| Retail Gasoline ($ per Gallon Regular, Monday Price, End of Period) | 2.64 | 2.65 | 2.55 | -7.8 | 2.27 | 2.47 | 2.31 |
| Light Sweet Crude Oil, WTI ($ per bbl, Previous Week's Average) | 56.94 | 59.30 | 56.17 | -21.7 | 64.95 | 50.87 | 43.22 |
| Natural Gas ($/mmbtu, LA, Previous Week's Average) | 2.53 | 2.63 | 2.64 | -17.5 | 3.18 | 2.99 | 2.51 |
Tom Moeller
AuthorMore in Author Profile »Prior to joining Haver Analytics in 2000, Mr. Moeller worked as the Economist at Chancellor Capital Management from 1985 to 1999. There, he developed comprehensive economic forecasts and interpreted economic data for equity and fixed income portfolio managers. Also at Chancellor, Mr. Moeller worked as an equity analyst and was responsible for researching and rating companies in the economically sensitive automobile and housing industries for investment in Chancellor’s equity portfolio. Prior to joining Chancellor, Mr. Moeller was an Economist at Citibank from 1979 to 1984. He also analyzed pricing behavior in the metals industry for the Council on Wage and Price Stability in Washington, D.C. In 1999, Mr. Moeller received the award for most accurate forecast from the Forecasters' Club of New York. From 1990 to 1992 he was President of the New York Association for Business Economists. Mr. Moeller earned an M.B.A. in Finance from Fordham University, where he graduated in 1987. He holds a Bachelor of Arts in Economics from George Washington University.
More Economy in Brief
 Global| Feb 05 2026
Charts of the Week: Balanced Policy, Resilient Data and AI Narratives
by:Andrew Cates


