 Global| Mar 24 2004
U.S. Durable Goods Orders Up, Revisions Negative
by:Tom Moeller
|in:Economy in Brief
Summary
Durable goods orders rose 2.5% last month and recovered from a downwardly revised 2.7% decline in January. Consensus expectations had been for a 1.5% rise in February orders. Non-defense capital goods orders rose 2.9% but the advance [...]
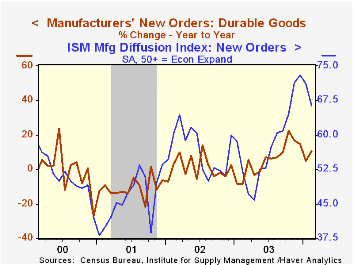
Durable goods orders rose 2.5% last month and recovered from a downwardly revised 2.7% decline in January. Consensus expectations had been for a 1.5% rise in February orders.
Non-defense capital goods orders rose 2.9% but the advance report of a 1.5% gain in January was reversed to show a 2.7% decline. Excluding aircraft and parts, orders rose 1.1% but January was revised down to a 0.3% decline versus the advance report of a 3.6% jump.
Orders for computers & electronic products rose 1.2% (15.6% y/y) but that followed a 4.2% gain in January that was about half the rise in the advance report.
Machinery orders rose 1.3% (+14.2% y/y) but January was taken down to a 4.6% drop from a 1.9% decline reported initially. Orders for electrical equipment, appliances & components fell 0.4% following a little-revised 3.6% January gain.
Excluding the transportation sector durable goods orders fell 0.3% (+10.4% y/y) after a 0.6% January gain, revised from 2.0%. Transportation equipment orders rose 9.9% following a little-revised 10.5% January drop. Aircraft orders rose 43.8% as both defense (27.6% y/y) and non-defense (29.8% y/y) orders soared m/m.
Shipments of durable goods recovered 0.8% (7.8% y/y) after the 1.0% January decline. Excluding transportation shipments fell 1.4% (8.2% y/y) but January was revised to slight decline.
Durable inventories rose for the fourth month in five, up 0.4% (-2.4% y/y).
"Global Gain, Local Pain" from the Federal Reserve Bank of Richmond examines the local costs of the Globalization of Manufacturing on this website.
| NAICS Classification | Feb | Jan | Y/Y | 2003 | 2002 | 2001 |
|---|---|---|---|---|---|---|
| Durable Goods Orders | 2.5% | -2.7% | 8.7% | 2.6% | -1.7% | -10.5% |
| Non-defense Capital Goods | 2.9% | -2.7% | 13.0% | 5.6% | -7.2% | -15.5% |
by Tom Moeller March 24, 2004
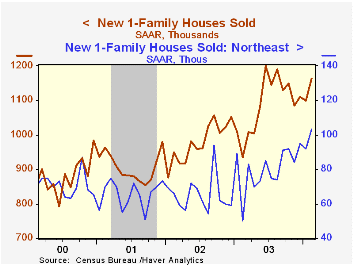
Sales of new single family homes jumped 5.8% m/m to 1.163M in February and were up 24.4% versus year ago sales that were socked by severe winter weather. Consensus estimates were for a smaller gain in sales to 1.100M. January sales were revised down slightly.
Sales were mixed m/m in the country's regions. Northeast sales jumped 12.0% and doubled the weather depressed '03 level. In the West sales surged 28.5% (39.3% y/y). Lower sales were logged in the Midwest, down 10.6% m/m (+2.2% y/y), and in the South, down 1.2% (+15.4% y/y).
The median price of a new home jumped 4.8% m/m to $205,500 (9.9% y/y).
These new home sales data from the US Census Department reflect current sales versus the existing home sale figures which reflect closings on past sales.
| Homes Sales (000s, AR) | Feb | Jan | Y/Y | 2003 | 2002 | 2001 |
|---|---|---|---|---|---|---|
| New Single-Family | 1,163 | 1,099 | 24.4% | 1,091 | 977 | 907 |
by Tom Moeller March 24, 2004
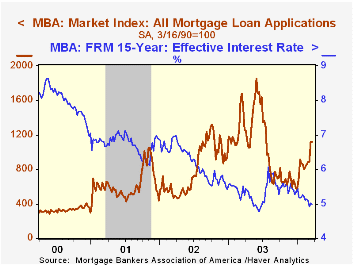
The index of mortgage applications compiled by the Mortgage Bankers Association dipped 0.2% last week following the 25.6% jump the prior period. It was the first weekly decline since early February.
Purchase applications fell 0.8% w/w (+17.0% y/y) and in March are 6.7% ahead of the February average.
During the last ten years there has been a 56% correlation between the y/y change in purchase applications and the change in new plus existing home sales.
Applications to refinance nudged 0.1% higher (-38.7% y/y) following five weeks of strong gain.
The effective interest rate on a conventional 30-Year mortgage was unchanged at 5.62%. The effective rate on a 15-year mortgage dipped slightly to 4.99%.
The Mortgage Bankers Association surveys between 20 to 35 of the top lenders in the U.S. housing industry to derive its refinance, purchase and market indexes. The weekly survey accounts for more than 40% of all applications processed each week by mortgage lenders. Visit the Mortgage Bankers Association site here.
| MBA Mortgage Applications (3/16/90=100) | 03/19/04 | 03/12/04 | 2003 | 2002 | 2001 |
|---|---|---|---|---|---|
| Total Market Index | 1,114.9 | 1,117.1 | 1,067.9 | 799.7 | 625.6 |
| Purchase | 448.9 | 452.4 | 395.1 | 354.7 | 304.9 |
| Refinancing | 4,988.7 | 4,983.7 | 4,981.8 | 3,388.0 | 2,491.0 |
by Tom Moeller March 24, 2004

The Chicago Fed National Activity Index (CFNAI) was 0.39 in February, positive for the seventh month in the last eight.
A zero value of the CFNAI indicates that the economy is expanding at its historical trend rate of growth.
During the last twenty years there has been a 76% correlation between the level of the CFNAI and quarterly growth in real GDP.
The three-month moving average of the CFNAI dipped slightly to 0.29 but was still near the high of the last four years.
The CFNAI is a weighted average of 85 indicators of economic activity. The indicators reflect activity in the following categories: production and income, the labor market, personal consumption and housing, manufacturing and trade sales, and inventories & orders.
For a complete discussion of the latest Chicago Fed's National Activity Index click here.
| Chicago Fed | Feb | Jan | Feb '03 | 2003 | 2002 | 2001 |
|---|---|---|---|---|---|---|
| CFNAI | 0.39 | 0.40 | -0.93 | -0.13 | -0.39 | -1.17 |

Tom Moeller
AuthorMore in Author Profile »Prior to joining Haver Analytics in 2000, Mr. Moeller worked as the Economist at Chancellor Capital Management from 1985 to 1999. There, he developed comprehensive economic forecasts and interpreted economic data for equity and fixed income portfolio managers. Also at Chancellor, Mr. Moeller worked as an equity analyst and was responsible for researching and rating companies in the economically sensitive automobile and housing industries for investment in Chancellor’s equity portfolio. Prior to joining Chancellor, Mr. Moeller was an Economist at Citibank from 1979 to 1984. He also analyzed pricing behavior in the metals industry for the Council on Wage and Price Stability in Washington, D.C. In 1999, Mr. Moeller received the award for most accurate forecast from the Forecasters' Club of New York. From 1990 to 1992 he was President of the New York Association for Business Economists. Mr. Moeller earned an M.B.A. in Finance from Fordham University, where he graduated in 1987. He holds a Bachelor of Arts in Economics from George Washington University.
More Economy in Brief


