 Global| Sep 27 2006
U.S. Durable Goods Orders Unexpectedly Lost Steam
by:Tom Moeller
|in:Economy in Brief
Summary
New orders for durable goods fell 0.5% last month after a 2.7% decline during August which was deeper than initially reported. Consensus expectations had been for a 0.5% increase, though a weakening had been hinted by the lower ISM [...]
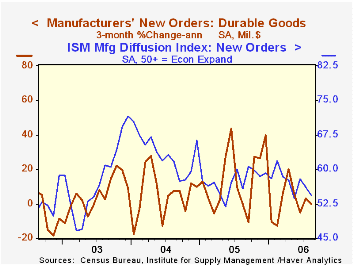
New orders for durable goods fell 0.5% last month after a 2.7% decline during August which was deeper than initially reported. Consensus expectations had been for a 0.5% increase, though a weakening had been hinted by the lower ISM index for new orders.
During the last ten years there has been a 69% correlation between the y/y change in durable goods orders and the change in output of durable goods.
Durable goods orders less the transportation sector fell 2.0% after no change during July. Orders for transportation equipment rose 3.7% (-0.8% y/y) after a 9.5% July decline and benefited from a 4.4% (-3.5% y/y) rise in motor vehicle & parts orders. That was offset by a 14.4% (-22.4% y/y) decline in aircraft & parts.
Orders for nondefense capital goods fell 3.5% and less aircraft ticked down 0.3%. Orders for machinery fell 2.1% (+9.9% y/y) while electrical equipment & appliance orders dropped 9.2% (-2.7% y/y). During the last ten years there has been an 86% correlation between the y/y change in capital goods orders less aircraft and the y/y change in business fixed investment in equipment & software from the GDP accounts.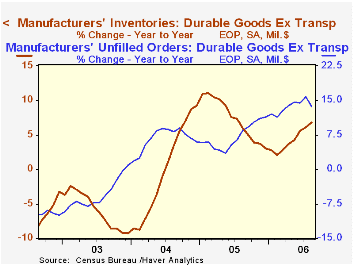
Orders for computers & electronic products reversed nearly all of the prior month's gain with a 4.7% (+3.2% y/y) drop. Computer orders fell 9.3% (-9.4% y/y) though orders for communications equipment recovered most of the July decline with a 7.0% (12.4% y/y) rise.
Shipments of durable goods jumped 1.9% (6.9% y/y) and less the transportation sector rose 0.5% (9.1% y/y). During the last ten years there has been an 82% correlation between the y/y change in durable goods shipments and the change in industrial production of durable goods.
Order backlogs inched up 0.4% (18.4% y/y) and less transportation rose just half (+13.7% y/y) that amount. Unfilled orders for nondefense aircraft & parts dipped 0.2% (+44.8% y/y).
Durable inventories rose 0.2% (6.2% y/y) after the 1.1% July spike. Less the transportation sector inventories rose 0.6% (6.8% y/y) after an upwardly revised 1.1% July pop. The inventory to shipments ratio outside of the transportation sector rose very slightly to its highest level since April.
The Productivity of Nations from the Federal Reserve Bank of Richmond can be found here.
| NAICS Classification | August | July | Y/Y | 2005 | 2004 | 2003 |
|---|---|---|---|---|---|---|
| Durable Goods Orders | -0.5% | -2.7% | 3.8% | 9.0% | 6.4% | -0.6% |
| Excluding Transportation | -2.0% | 0.0% | 5.8% | 9.4% | 7.6% | -1.7% |
| Nondefense Capital Goods | -3.5% | -0.6% | 0.7% | 21.4% | 5.6% | -3.4% |
| Excluding Aircraft | -0.3% | 0.9% | 7.2% | 12.3% | 2.8% | -2.0% |

Tom Moeller
AuthorMore in Author Profile »Prior to joining Haver Analytics in 2000, Mr. Moeller worked as the Economist at Chancellor Capital Management from 1985 to 1999. There, he developed comprehensive economic forecasts and interpreted economic data for equity and fixed income portfolio managers. Also at Chancellor, Mr. Moeller worked as an equity analyst and was responsible for researching and rating companies in the economically sensitive automobile and housing industries for investment in Chancellor’s equity portfolio. Prior to joining Chancellor, Mr. Moeller was an Economist at Citibank from 1979 to 1984. He also analyzed pricing behavior in the metals industry for the Council on Wage and Price Stability in Washington, D.C. In 1999, Mr. Moeller received the award for most accurate forecast from the Forecasters' Club of New York. From 1990 to 1992 he was President of the New York Association for Business Economists. Mr. Moeller earned an M.B.A. in Finance from Fordham University, where he graduated in 1987. He holds a Bachelor of Arts in Economics from George Washington University.
More Economy in Brief


