 Global| Sep 27 2005
U.S. Durable Goods Orders Rebounded
by:Tom Moeller
|in:Economy in Brief
Summary
US durable goods orders in August recouped much of the prior month's decline with a 3.3% rise that far exceeded Consensus expectations for a 0.8% increase. The volatility of orders in the transportation sector recently has been [...]
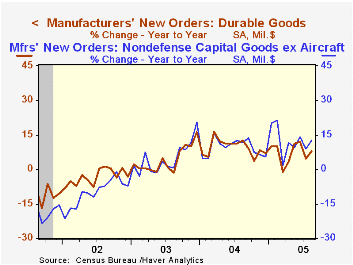
US durable goods orders in August recouped much of the prior month's decline with a 3.3% rise that far exceeded Consensus expectations for a 0.8% increase.
The volatility of orders in the transportation sector recently has been extreme. In August, a 10.4% rise in aircraft orders followed an 18.8% July decline. Less transportation altogether, durable goods orders rose 4.2% last month to a record high.
Strength in nondefense capital goods orders also has been somewhat masked by the volatility in the transportation sector. Overall nondefense capital goods orders last month recovered most of the prior month's decline with a 4.3% increase but less aircraft these orders rose 3.6% to the highest level since 2000.
Electrical equipment orders rose a notable 8.1% (10.6% y/y) last month while machinery orders increased 3.5% (8.2% y/y). Computer & electronic products orders increased 5.5% (14.7% y/y) goosed by a 10.7% (26.4% y/y) gain in computers.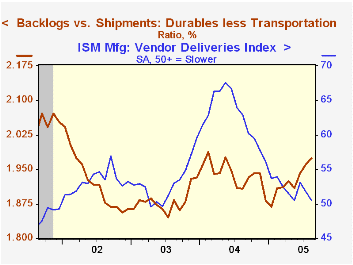
Orders for fabricated metals products rose 4.6% (3.1% y/y) to a record high while primary metal orders surged 9.2% (2.5% y/y), also a record.
Shipments of durable goods rose 1.7% (4.3% y/y) in August but less transportation shipments rose a stronger 1.2% (5.4% y/y).
Order backlogs surged 1.7%(10.3% y/y). Backlogs excluding transportation also were firm and rose 1.9% (9.1% y/y) due to broad based strength. The ratio of backlogs to shipments excluding transportation rose to the highest since last year.
Durable inventories fell 0.2% (+5.6% y/y) following an upwardly revised 0.8% rise in July.
Chairman Greenspan's comments to the National Association for Business Economists titled Economic Flexibility can be found here.
| NAICS Classification | Aug | July | Y/Y | 2004 | 2003 | 2002 |
|---|---|---|---|---|---|---|
| Durable Goods Orders | 3.3% | -5.3% | 7.9% | 9.5% | 4.1% | -3.4% |
| Excluding Transportation | 4.2% | -3.7% | 7.5% | 11.7% | 3.1% | -6.2% |
| Nondefense Capital Goods | 4.3% | -7.1% | 21.2% | 11.0% | 4.2% | -9.8% |
| Excluding Aircraft | 3.6% | -3.3% | 12.4% | 9.5% | 4.8% | -10.5% |

Tom Moeller
AuthorMore in Author Profile »Prior to joining Haver Analytics in 2000, Mr. Moeller worked as the Economist at Chancellor Capital Management from 1985 to 1999. There, he developed comprehensive economic forecasts and interpreted economic data for equity and fixed income portfolio managers. Also at Chancellor, Mr. Moeller worked as an equity analyst and was responsible for researching and rating companies in the economically sensitive automobile and housing industries for investment in Chancellor’s equity portfolio. Prior to joining Chancellor, Mr. Moeller was an Economist at Citibank from 1979 to 1984. He also analyzed pricing behavior in the metals industry for the Council on Wage and Price Stability in Washington, D.C. In 1999, Mr. Moeller received the award for most accurate forecast from the Forecasters' Club of New York. From 1990 to 1992 he was President of the New York Association for Business Economists. Mr. Moeller earned an M.B.A. in Finance from Fordham University, where he graduated in 1987. He holds a Bachelor of Arts in Economics from George Washington University.
More Economy in Brief


