 Global| May 25 2005
U.S. Durable Goods Orders Rebounded
by:Tom Moeller
|in:Economy in Brief
Summary
New orders for durable goods rebounded 1.9% in April following three consecutive months of decline. Consensus expectations had been for a 1.2% rise. Year to date orders are down 1.1%. An 8.2% jump in orders for transportation [...]
New orders for durable goods rebounded 1.9% in April following three consecutive months of decline. Consensus expectations had been for a 1.2% rise. Year to date orders are down 1.1%.
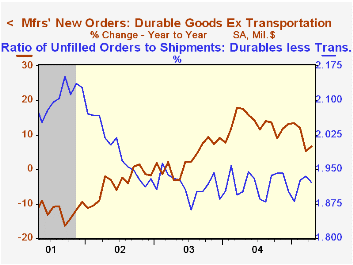
An 8.2% jump in orders for transportation equipment pulled the April total up and reflected a 28.2% (18.5% y/y) rise in nondefense aircraft & parts as well as a 3.4% (-5.0% y/y) gain in motor vehicles & parts. Less transportation durable orders fell 0.2% (+6.8% y/y), marking the third month of roughly sideways movement.
With a 3.8% jump, orders for non-defense capital goods recovered all of the prior month's decline. A 1.6% gain in orders less aircraft also recovered most of March's drop but that decline was lessened considerably. Computer & electronic product orders fell 5.8% (+6.8% y/y) following a 4.7% jump in March that was double the gain initially estimated. Machinery orders rose 2.2% and recovered nearly half the prior month's drop while electrical equipment orders rose 3.4% after two months of sharp decline.
Shipments of durables rose 1.6% (6.4% y/y). Orders outside of transportation increased 1.0% (8.3% y/y) due to a 1.5% (9.3% y/y) increase in machinery shipments and a 1.9% jump (5.2% y/y) in electrical equipment.
Durable inventories ticked just 0.1% (9.2% y/y) higher causing the I/S ratio to drop sharply. Less transportation the I/S ratio has moved sideways in a narrow range since early last year.
Unfilled orders were roughly unchanged (+6.2% y/y). The ratio of backlogs to shipments fell sharply to the low end of the year's range.
| NAICS Classification | April | March | Y/Y | 2004 | 2003 | 2002 |
|---|---|---|---|---|---|---|
| Durable Goods Orders | 1.9% | -1.6% | 4.3% | 10.8% | 2.6% | -1.7% |
| Nondefense Capital Goods | 3.8% | -3.2% | 10.1% | 13.7% | 5.6% | -7.2% |
| Excluding Aircraft | 1.6% | -1.6% | 9.3% | 11.7% | 6.6% | -7.1% |

Tom Moeller
AuthorMore in Author Profile »Prior to joining Haver Analytics in 2000, Mr. Moeller worked as the Economist at Chancellor Capital Management from 1985 to 1999. There, he developed comprehensive economic forecasts and interpreted economic data for equity and fixed income portfolio managers. Also at Chancellor, Mr. Moeller worked as an equity analyst and was responsible for researching and rating companies in the economically sensitive automobile and housing industries for investment in Chancellor’s equity portfolio. Prior to joining Chancellor, Mr. Moeller was an Economist at Citibank from 1979 to 1984. He also analyzed pricing behavior in the metals industry for the Council on Wage and Price Stability in Washington, D.C. In 1999, Mr. Moeller received the award for most accurate forecast from the Forecasters' Club of New York. From 1990 to 1992 he was President of the New York Association for Business Economists. Mr. Moeller earned an M.B.A. in Finance from Fordham University, where he graduated in 1987. He holds a Bachelor of Arts in Economics from George Washington University.
More Economy in Brief


