 Global| Dec 24 2003
U.S. Durable Goods Orders Plunged
by:Tom Moeller
|in:Economy in Brief
Summary
Durable goods orders unwound much of the prior month's strength with a 3.1% plunge in November. October orders were revised up to a 4.0% gain from the advance report of a 3.3% jump. Consensus expectations had been for a 1.0% rise in [...]

Durable goods orders unwound much of the prior month's strength with a 3.1% plunge in November. October orders were revised up to a 4.0% gain from the advance report of a 3.3% jump. Consensus expectations had been for a 1.0% rise in November.
Excluding the volatile transportation sector durable goods orders unwound all of October's little-revised 3.0% jump. Orders for transportation equipment fell 1.6% (+6.1% y/y). Orders for nondefense aircraft fell 13.9% following a 20.6% October gain.
Nondefense capital goods orders excluding aircraft and parts cratered 5.9% (+7.3% y/y) and gave back much of the strong gains in the prior two months.
Orders for computers & related products dropped 10.8% (+11.9% y/y) but the prior month's decline was revised to a 2.6% gain. Orders for communication equipment evaporated in November, down 40.0% (-8.1% y/y). Electrical equipment orders fell 2.6% (-1.1% y/y).
Shipments of durable goods rose 0.1% (+3.7% y/y) but the prior month's strength was revised down. Excluding transportation shipments fell 0.6% (3.7% y/y).
Durable inventories resumed liquidation and fell 0.1% (-2.8% y/y) after the 0.3% October gain.
| NAICS Classification | Nov | Oct | Y/Y | 2002 | 2001 | 2000 |
|---|---|---|---|---|---|---|
| Durable Goods Orders | -3.1% | 4.0% | 6.7% | -1.7% | -10.5% | 3.2% |
| Nondefense Capital Goods | -6.4% | 2.5% | 6.1% | -7.2% | -15.5% | 7.4% |
by Tom Moeller December 24, 2003
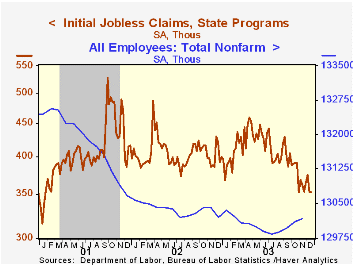
Initial claims for jobless insurance fell last week to 353,000. The prior week's level was revised to 354,000 from 353,000 reported initially. Consensus expectations had been for claims of 355,000.
The four-week moving average of initial claims fell to 361,750 (-11.1% y/y).
Continuing claims for unemployment insurance fell 38,000 to the lowest level since September '01. The prior week's initial report of a 28,000 increase was revised to a decline of 8,000.
The insured rate of unemployment was unchanged at 2.6% for the fifth straight week.
| Unemployment Insurance (000s) | 12/20 | 12/13 | Y/Y | 2002 | 2001 | 2000 |
|---|---|---|---|---|---|---|
| Initial Claims | 353.0 | 354.0 | -9.9% | 404.3 | 406.0 | 299.7 |
| Continuing Claims | -- | 3,269 | -6.3% | 3,575 | 3,022 | 2,114 |
by Tom Moeller December 24, 2003
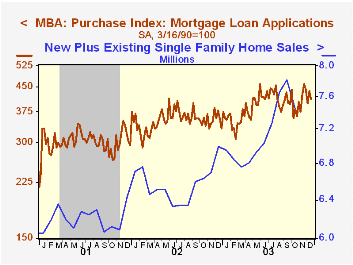
The index of mortgage applications compiled by the Mortgage Bankers Association fell 6.8% (-30.5% y/y) last week .
Purchase applications fell 5.9% w/w (+14.5% y/y) and purchase applications so far in December are down 2.2% from the November average.
Applications to refinance gave back half of the prior week's gain with a 7.9% w/w drop. December refis are down 13.2% from November (-53.5% y/y).
During the last ten years there has been a 54% correlation between the y/y change in purchase applications and the change in new plus existing home sales.
The effective interest rate on a conventional 30-Year mortgage fell to 5.93%. The effective rate on a 15-year mortgage also fell to 5.27%.
The Mortgage Bankers Association surveys between 20 to 35 of the top lenders in the U.S. housing industry to derive its refinance, purchase and market indexes. The weekly survey accounts for more than 40% of all applications processed each week by mortgage lenders. Visit the Mortgage Bankers Association site here.
| MBA Mortgage Applications (3/16/90=100) | 12/19 | 12/12 | 2002 | 2001 | 2000 |
|---|---|---|---|---|---|
| Total Market Index | 631.2 | 677.2 | 799.7 | 625.6 | 322.7 |
| Purchase | 411.6 | 437.2 | 354.7 | 304.9 | 302.7 |
| Refinancing | 1,908.3 | 2,072.9 | 3,388.0 | 2,491.0 | 438.8 |
by Tom Moeller December 24, 2003
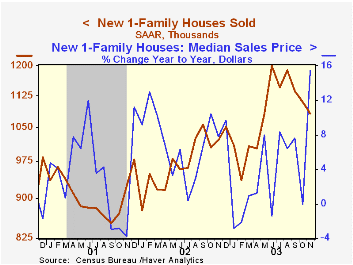
Sales of new single family homes fell 2.4% in November to 1.082M (AR). It was the fourth decline in the last five months and sales have fallen 9.8% from the record high in June. Consensus estimates were for a lesser decline to 1.125M.
Sales declines were spread across the country except in the South where they rose slightly.
The median price of a new home rose sharply to $209,200 (15.5% y/y).
These new home sales data from the US Census Department reflect current sales versus the existing home sale figures which reflect closings on past sales.
| Homes Sales (000s, AR) | Nov | Oct | Y/Y | 2002 | 2001 | 2000 |
|---|---|---|---|---|---|---|
| New Single-Family | 1,082 | 1,109 | 5.9% | 977 | 907 | 880 |

Tom Moeller
AuthorMore in Author Profile »Prior to joining Haver Analytics in 2000, Mr. Moeller worked as the Economist at Chancellor Capital Management from 1985 to 1999. There, he developed comprehensive economic forecasts and interpreted economic data for equity and fixed income portfolio managers. Also at Chancellor, Mr. Moeller worked as an equity analyst and was responsible for researching and rating companies in the economically sensitive automobile and housing industries for investment in Chancellor’s equity portfolio. Prior to joining Chancellor, Mr. Moeller was an Economist at Citibank from 1979 to 1984. He also analyzed pricing behavior in the metals industry for the Council on Wage and Price Stability in Washington, D.C. In 1999, Mr. Moeller received the award for most accurate forecast from the Forecasters' Club of New York. From 1990 to 1992 he was President of the New York Association for Business Economists. Mr. Moeller earned an M.B.A. in Finance from Fordham University, where he graduated in 1987. He holds a Bachelor of Arts in Economics from George Washington University.
More Economy in Brief


