 Global| Feb 24 2006
U.S. Durable Goods Orders Plunge Due To Aircraft
by:Tom Moeller
|in:Economy in Brief
Summary
Durable goods orders plunged 10.2% last month following an upwardly revised 2.5% increase during December. The drop far outpaced Consensus expectations for a 2.0% decline, however, the details of the report again portrayed a [...]
Durable goods orders plunged 10.2% last month following an upwardly revised 2.5% increase during December. The drop far outpaced Consensus expectations for a 2.0% decline, however, the details of the report again portrayed a constructive picture of activity in the factory sector.
Aircraft & parts orders, which had more than doubled during the prior three months, fell 60.3% m/m yet remained up 59.4% from January of 2005.
New orders for motor vehicles & parts also fell, by 3.3% (+0.9% y/y) and have been moving erratically sideways since late 2003.
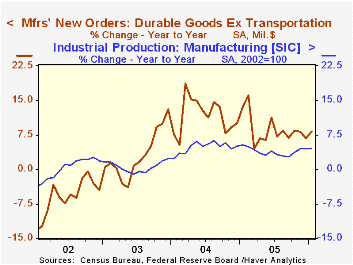
Less the transportation sector altogether, durable goods orders rose 0.6% following an upwardly revised 1.9% increase during December and during the last six months have risen at an accelerated 16.4% annual rate.
Higher electrical equipment orders led the strength in January with a 2.7% (7.5% y/y) gain. Orders for fabricated metals (5.8% y/y) & primary metals (10.0% y/y) also rose but machinery orders reversed 2.5% (14.7% y/y) of an upwardly revised 9.5% December surge. Orders for computers & electronic products also slipped 0.4% (+2.2% y/y) due to an 11.0% (+4.0% y/y) plunge in computer orders.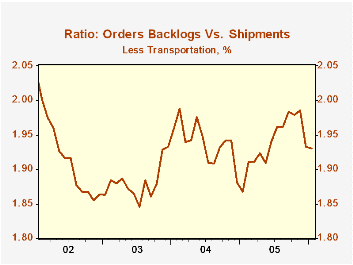
Orders for nondefense capital goods collapsed 20.0% due to the drop in aircraft but less aircraft, nondefense capital goods orders slipped just 0.4% after an upwardly revised 5.0% December surge.
Shipments of durable goods fell 1.3% (+6.5% y/y) after an upwardly revised 4.1% gain during December. Less the transportation sector shipments added 0.4% (6.8% y/y) to the upwardly revised 3.1% December increase.
Order backlogs slipped 0.8% (+16.0% y/y) but less transportation backlogs gained another 0.3% (10.4% y/y). The ratio of backlogs to shipments outside of transportation slipped and was squarely in the middle of the range of the last two years.
Durable inventories rose 0.3% (3.0% y/y).
| NAICS Classification | Jan | Dec | Y/Y | 2005 | 2004 | 2003 |
|---|---|---|---|---|---|---|
| Durable Goods Orders | -10.2% | 2.5% | 5.4% | 8.6% | 9.5% | 4.1% |
| Excluding Transportation | 0.6% | 1.9% | 8.3% | 8.6% | 11.7% | 3.1% |
| Nondefense Capital Goods | -20.0% | 2.0% | 10.2% | 20.0% | 11.0% | 4.2% |
| Excluding Aircraft | -0.4% | 5.0% | 6.5% | 10.7% | 9.5% | 4.8% |

Tom Moeller
AuthorMore in Author Profile »Prior to joining Haver Analytics in 2000, Mr. Moeller worked as the Economist at Chancellor Capital Management from 1985 to 1999. There, he developed comprehensive economic forecasts and interpreted economic data for equity and fixed income portfolio managers. Also at Chancellor, Mr. Moeller worked as an equity analyst and was responsible for researching and rating companies in the economically sensitive automobile and housing industries for investment in Chancellor’s equity portfolio. Prior to joining Chancellor, Mr. Moeller was an Economist at Citibank from 1979 to 1984. He also analyzed pricing behavior in the metals industry for the Council on Wage and Price Stability in Washington, D.C. In 1999, Mr. Moeller received the award for most accurate forecast from the Forecasters' Club of New York. From 1990 to 1992 he was President of the New York Association for Business Economists. Mr. Moeller earned an M.B.A. in Finance from Fordham University, where he graduated in 1987. He holds a Bachelor of Arts in Economics from George Washington University.
More Economy in Brief


