 Global| Jun 23 2006
U.S. Durable Goods Orders Off Slightly
by:Tom Moeller
|in:Economy in Brief
Summary
New orders for durable goods fell 0.3% last month after a little revised 4.7% drop during April. Consensus expectations had been for a 0.5% decline. Lower Boeing orders dropped nondefense aircraft & parts bookings by 17.9% (-38.7% [...]
New orders for durable goods fell 0.3% last month after a little revised 4.7% drop during April. Consensus expectations had been for a 0.5% decline.
Lower Boeing orders dropped nondefense aircraft & parts bookings by 17.9% (-38.7% y/y) after a 29.7% decline during April. A partial offset to that decline came from a 2.5% (0.6% y/y) increase in new orders for motor vehicles & parts.
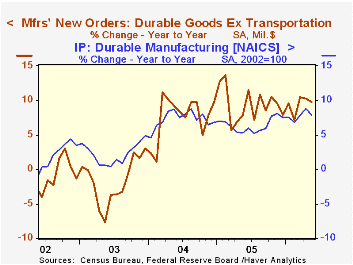
Less the transportation sector altogether durable goods orders recovered most of the prior month's decline with 0.7% gain.
During the last ten years there has been a 69% correlation between the y/y change in durable goods orders and the change in output of durable goods.
Dragged down by the decline in aircraft, orders for nondefense capital goods fell 1.9%. Less aircraft, these orders recovered half of the prior month's decline with a 1.0% gain. During the last ten years there has been an 86% correlation between the y/y change in capital goods orders less aircraft and the y/y change in business fixed investment in equipment & software from the GDP accounts.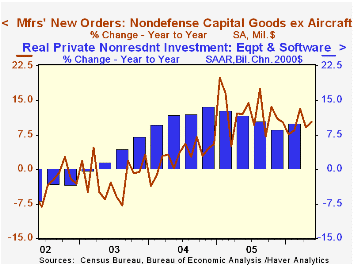
Machinery orders jumped 2.3% (15.0% y/y) but electrical equipment orders slipped 0.2% (+13.4% y/y) after a 6.6% April spike. Primary metals surged 3.5% (22.2% y/y), surging for the third consecutive month. Orders for computers & electronic products fell 1.1% (+7.5% y/y) after a 10.8% April slump though computer orders alone rose 1.9% (1.0% y/y).
Shipments of durable goods jumped 2.6% (7.7% y/y) after a 1.2% April decline. Shipments less the transportation sector surged 1.8% (9.0% y/y). During the last ten years there has been an 82% correlation between the y/y change in durable goods shipments and the change in industrial production of durable goods.
Order backlogs rose another 0.6% (20.7% y/y) reflecting a 1.5% jump in nondefense aircraft & parts (59.4% y/y). Also strong was the 0.9% (14.3% y/y) rise in unfilled orders less transportation. The ratio of backlogs to shipments outside of transportation slipped moderately after surging in April.
Durable inventories rose 0.4% (3.3% y/y) after an upwardly revised 1.1% April increase. Less transportation inventories rose 0.3% (3.8% y/y) after two months of 1.0% gain. The inventory to sales ratio outside of the transportation sector gave back all of the prior month's increase.
| NAICS Classification | May | April | Y/Y | 2005 | 2004 | 2003 |
|---|---|---|---|---|---|---|
| Durable Goods Orders | -0.3% | -4.7% | 3.3% | 9.0% | 6.4% | -0.6% |
| Excluding Transportation | 0.7% | -1.0% | 9.8% | 9.4% | 7.6% | -1.7% |
| Nondefense Capital Goods | -1.9% | -6.3% | -1.7% | 21.4% | 5.6% | -3.4% |
| Excluding Aircraft | 1.0% | -1.9% | 10.3% | 12.3% | 2.8% | -2.0% |

Tom Moeller
AuthorMore in Author Profile »Prior to joining Haver Analytics in 2000, Mr. Moeller worked as the Economist at Chancellor Capital Management from 1985 to 1999. There, he developed comprehensive economic forecasts and interpreted economic data for equity and fixed income portfolio managers. Also at Chancellor, Mr. Moeller worked as an equity analyst and was responsible for researching and rating companies in the economically sensitive automobile and housing industries for investment in Chancellor’s equity portfolio. Prior to joining Chancellor, Mr. Moeller was an Economist at Citibank from 1979 to 1984. He also analyzed pricing behavior in the metals industry for the Council on Wage and Price Stability in Washington, D.C. In 1999, Mr. Moeller received the award for most accurate forecast from the Forecasters' Club of New York. From 1990 to 1992 he was President of the New York Association for Business Economists. Mr. Moeller earned an M.B.A. in Finance from Fordham University, where he graduated in 1987. He holds a Bachelor of Arts in Economics from George Washington University.
More Economy in Brief


