 Global| Jul 26 2007
U.S. Durable Goods Orders Missed Forecasts
by:Tom Moeller
|in:Economy in Brief
Summary
The 1.4% rise in new orders for durable goods during June missed Consensus expectations for a 1.6% increase. Though the shortfall was only slight, the gain failed to make up for a 2.3% decline during May and other details within the [...]
The 1.4% rise in new orders for durable goods during June missed Consensus expectations for a 1.6% increase. Though the shortfall was only slight, the gain failed to make up for a 2.3% decline during May and other details within the report were soft.
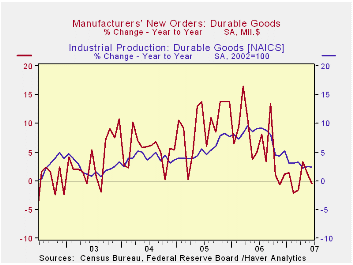
During the last ten years there has been a 67% correlation between the y/y change in durable goods orders and the change in production of durable goods.
Orders for nondefense capital goods did jump 4.6% last month, but again the increase failed to make up the prior month’s 6.8% decline. And excluding aircraft & parts orders fell 0.7%, the fourth decline this year and it pulled the y/y change to a negative 2.4%. During the last ten years there has been an 84% correlation between the y/y change in capital goods orders less aircraft and the y/y change in business fixed investment in equipment & software from the GDP accounts.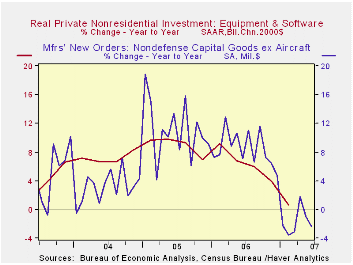
Orders for computers & electronic products fell 4.6% (-3.2% y/y) after a 5.0% gain during May. Orders for just computers & related products fell 3.9% (-2.2% y/y). Primary metals orders dropped 3.6% (-3.3% y/y) after a 4.7% slide during May. And the 1.5% (2.8% y/y) increase in electrical equipment orders during June only recouped about half of the prior month’s 3.8% slip.
Shipments of durable goods fell 1.1% (-0.8% y/y) after a modest 0.6% increase during May. Less the transportation sector shipments fell 1.1% (-0.2% y/y). During the last ten years there has been an 82% correlation between the y/y change in durable goods shipments and the change in industrial production of durable goods. The June decline reflected a 4.0% (-1.3% y/y) drop in shipments of computers & electronic products but a firm 0.7% (15.9% y/y) rise in shipments of machinery.
| NAICS Classification | June | May | Y/Y | 2006 | 2005 | 2004 |
|---|---|---|---|---|---|---|
| Durable Goods Orders | 1.4% | -2.3% | -0.6% | 6.3% | 9.9% | 5.3% |
| Excluding Transportation | -0.5% | -0.2% | -1.7% | 7.6% | 8.8% | 7.9% |
| Nondefense Capital Goods | 4.6% | -6.8% | 6.5% | 10.6% | 17.1% | 5.7% |
| Excluding Aircraft | -0.7% | -1.5% | -2.4% | 8.5% | 11.1% | 3.2% |

Tom Moeller
AuthorMore in Author Profile »Prior to joining Haver Analytics in 2000, Mr. Moeller worked as the Economist at Chancellor Capital Management from 1985 to 1999. There, he developed comprehensive economic forecasts and interpreted economic data for equity and fixed income portfolio managers. Also at Chancellor, Mr. Moeller worked as an equity analyst and was responsible for researching and rating companies in the economically sensitive automobile and housing industries for investment in Chancellor’s equity portfolio. Prior to joining Chancellor, Mr. Moeller was an Economist at Citibank from 1979 to 1984. He also analyzed pricing behavior in the metals industry for the Council on Wage and Price Stability in Washington, D.C. In 1999, Mr. Moeller received the award for most accurate forecast from the Forecasters' Club of New York. From 1990 to 1992 he was President of the New York Association for Business Economists. Mr. Moeller earned an M.B.A. in Finance from Fordham University, where he graduated in 1987. He holds a Bachelor of Arts in Economics from George Washington University.
More Economy in Brief


