 Global| Jan 26 2007
U.S. Durable Goods Orders Firmed, Inventories Up
by:Tom Moeller
|in:Economy in Brief
Summary
The 3.1% surge in new orders for durable goods about matched Consensus expectations and followed an upwardly revised 2.2% increase in November. For the year durable goods orders rose 7.1%, down just moderately from the 9.0% gain [...]
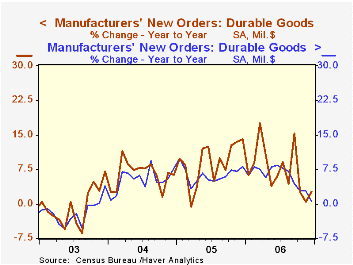
The 3.1% surge in new orders for durable goods about matched Consensus expectations and followed an upwardly revised 2.2% increase in November. For the year durable goods orders rose 7.1%, down just moderately from the 9.0% gain during 2005 but much of the strength reflected gains at the end of 2005 and early 2006.
During the last ten years there has been a 69% correlation between the y/y change in durable goods orders and the change in output of durable goods..
Another strong 24.8% (-8.6% y/y) gain in total aircraft & parts orders boosted durable goods bookings last month after a 13.2% rise during November. Orders for motor vehicles & parts even turned in a sharp 6.8% (0.0% y/y) gain. Yet less transportation altogether, orders still rose 2.3% and made up for most of the declines during the prior two months.
Orders for nondefense capital goods less aircraft rose 2.4% reflecting a 5.0% (6.1% y/y) surge in machinery orders. During the last ten years there has been an 86% correlation between the y/y change in capital goods orders less aircraft and the y/y change in business fixed investment in equipment & software from the GDP accounts.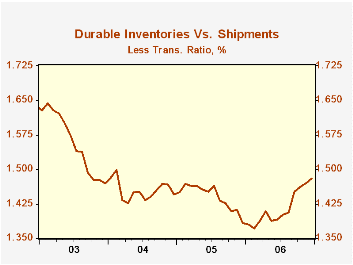
Orders for computers & electronic products rose 1.0% (11.4% y/y) after an 8.0% November spike. Primary metals orders also jumped 4.5% (9.1% y/y) making up nearly all of the declines during the prior tree months.
Shipments of durable goods gained 0.8% (0.5% y/y) after flat-to-down movement over the prior several months. Less the transportation sector, however, shipments fell 0.1% (+2.1% y/y) for the fourth consecutive monthly decline. During the last ten years there has been an 82% correlation between the y/y change in durable goods shipments and the change in industrial production of durable goods.
Durable inventories again rose moderately, by 0.4% (8.4% y/y) after a 0.3% November rise. Less the transportation sector, however, inventories doubled the modest 0.3% November gain with a 0.6% (9.3% y/y) increase. The inventory to shipments ratio outside of transportation, as a result, rose further to the highest level since early 2004.
| NAICS Classification | December | November | Y/Y | 2006 | 2005 | 2004 |
|---|---|---|---|---|---|---|
| Durable Goods Orders | 3.1% | 2.2% | 2.6% | 7.1% | 9.0% | 6.4% |
| Excluding Transportation | 2.3% | -1.0% | 5.1% | 8.1% | 9.4% | 7.6% |
| Nondefense Capital Goods | 9.0% | -0.3% | 0.9% | 9.7% | 21.4% | 5.6% |
| Excluding Aircraft | 2.4% | -1.0% | 6.7% | 9.2% | 12.3% | 2.8% |

Tom Moeller
AuthorMore in Author Profile »Prior to joining Haver Analytics in 2000, Mr. Moeller worked as the Economist at Chancellor Capital Management from 1985 to 1999. There, he developed comprehensive economic forecasts and interpreted economic data for equity and fixed income portfolio managers. Also at Chancellor, Mr. Moeller worked as an equity analyst and was responsible for researching and rating companies in the economically sensitive automobile and housing industries for investment in Chancellor’s equity portfolio. Prior to joining Chancellor, Mr. Moeller was an Economist at Citibank from 1979 to 1984. He also analyzed pricing behavior in the metals industry for the Council on Wage and Price Stability in Washington, D.C. In 1999, Mr. Moeller received the award for most accurate forecast from the Forecasters' Club of New York. From 1990 to 1992 he was President of the New York Association for Business Economists. Mr. Moeller earned an M.B.A. in Finance from Fordham University, where he graduated in 1987. He holds a Bachelor of Arts in Economics from George Washington University.
More Economy in Brief


