 Global| Jul 27 2005
U.S. Durable Goods Orders Firm, Revisions Positive
by:Tom Moeller
|in:Economy in Brief
Summary
New orders for durable goods added 1.4% last month to the upwardly revised 6.4% jump in May. Consensus expectations had been for a 1.0% decline. Strength in the factory sector was quite apparent in a 2.6% rise in durable goods orders [...]
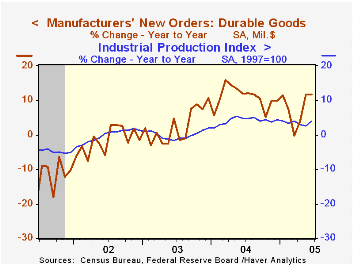
New orders for durable goods added 1.4% last month to the upwardly revised 6.4% jump in May. Consensus expectations had been for a 1.0% decline.
Strength in the factory sector was quite apparent in a 2.6% rise in durable goods orders outside of the transportation sector as well as a 0.9% gain in these orders in May, revised up from a 0.2% decline reported initially. Computer & electronic equipment orders jumped 8.6% (19.0% y/y) after a 1.5% May rise, initially reported as a 1.2% decline. Orders for communication equipment surged 18.3% and were one third higher than last year.
Machinery orders jumped 3.7% (11.9% y/y) but with a 0.1% decline (+13.1% y/y) electrical equipment orders gave back a piece of the very much upwardly revised 3.4% spurt in May.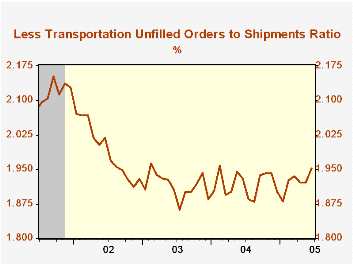
Orders for aircraft & parts fell just 22.1% (+49.8% y/y) following the more-than-doubling of orders in May while orders for motor vehicles & parts slipped 0.1% (-2.3% y/y).
Non-defense capital goods orders slipped due to the decline in aircraft but less aircraft orders posted the strongest monthly gain since January. Nevertheless, shipments of nondefense capital goods less aircraft fell 0.4% (+10.1% y/y). The decline in shipments followed gains of 1.2% and 1.5% during the prior two months.
Durable inventories fell 0.3% (+7.1% y/y) for the second monthly decline in the last three while May's gain was revised lower to just 0.1%.
Unfilled orders jumped another 2.6% (9.8% y/y) but outside of the transportation sector backlogs rose a lesser 1.6% (9.2% y/y). The ratio of backlogs to shipments outside of transportation rose to the highest level in over a year.
| NAICS Classification | June | May | Y/Y | 2004 | 2003 | 2002 |
|---|---|---|---|---|---|---|
| Durable Goods Orders | 1.4% | 6.4% | 11.8% | 10.8% | 2.6% | -1.7% |
| Excluding Transportation | 2.6% | 0.9% | 10.6% | 13.1% | 3.2% | -4.2% |
| Nondefense Capital Goods | -1.9% | 16.1% | 25.7% | 13.7% | 5.6% | -7.2% |
| Excluding Aircraft | 3.8% | -0.6% | 13.0% | 11.7% | 6.6% | -7.1% |
by Tom Moeller July 27, 2005
New single-family home sales jumped 4.0% in June to 1.374M on top of the upwardly revised 3.0% gain in May. The figure set a new record and sales during the last six months averaged 1.288M, up 7.7% from last year's first six months. Consensus estimates had been for sales in June of 1.30M.
Sales rose across the country but the notable 7.2% rise in the Northeast lifted sales 14.1% versus last year.
The median price of a new single family home slipped for the second consecutive month. The 5.5% decline to $214,800 (-0.4% y/y) followed upward revisions to prior months' figures.
The figures from the Census Department reflect homes sold.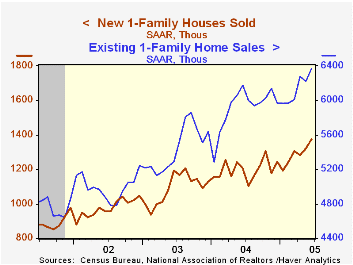

| Homes Sales (000s, AR) | June | May | Y/Y | 2004 | 2003 | 2002 |
|---|---|---|---|---|---|---|
| New Single-Family | 1,298 | 1,271 | 4.4% | 1,200 | 1,091 | 976 |
by Tom Moeller July 27, 2005
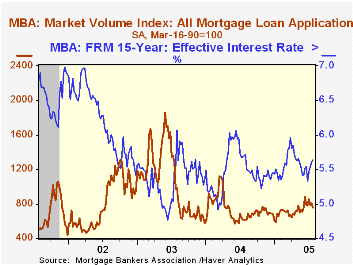
Total mortgage applications fell 5.8% last week, the fourth decline in the last six weeks according to the Mortgage Bankers Association. The decline lowered the average level in July 0.2% below June.
Last week's decline was led by a 11.4% drop in applications to refinance and they are down 21.8% from the peak in early June.
Purchase applications slipped only 0.7% w/w but it was the fifth decline in the last six weeks. Nevertheless, the average level in July remained 0.9% ahead of June. During the last ten years there has been a 49% correlation between the y/y change in purchase applications and the change in new plus existing single family home sales.
The effective interest rate on a conventional 30-year mortgage crept up to 5.98% while the effective rate on a 15-year mortgage also rose to 5.63%.
The Mortgage Bankers Association surveys between 20 to 35 of the top lenders in the U.S. housing industry to derive its refinance, purchase and market indexes. The weekly survey accounts for more than 40% of all applications processed each week by mortgage lenders. Visit the Mortgage Bankers Association site here.
| MBA Mortgage Applications (3/16/90=100) | 07/22/05 | 07/15/05 | Y/Y | 2004 | 2003 | 2002 |
|---|---|---|---|---|---|---|
| Total Market Index | 754.3 | 801.1 | 21.4% | 735.1 | 1,067.9 | 799.7 |
| Purchase | 485.1 | 488.7 | 9.1% | 454.5 | 395.1 | 354.7 |
| Refinancing | 2,320.2 | 2,618.2 | 40.7% | 2,366.8 | 4,981.8 | 3,388.0 |

Tom Moeller
AuthorMore in Author Profile »Prior to joining Haver Analytics in 2000, Mr. Moeller worked as the Economist at Chancellor Capital Management from 1985 to 1999. There, he developed comprehensive economic forecasts and interpreted economic data for equity and fixed income portfolio managers. Also at Chancellor, Mr. Moeller worked as an equity analyst and was responsible for researching and rating companies in the economically sensitive automobile and housing industries for investment in Chancellor’s equity portfolio. Prior to joining Chancellor, Mr. Moeller was an Economist at Citibank from 1979 to 1984. He also analyzed pricing behavior in the metals industry for the Council on Wage and Price Stability in Washington, D.C. In 1999, Mr. Moeller received the award for most accurate forecast from the Forecasters' Club of New York. From 1990 to 1992 he was President of the New York Association for Business Economists. Mr. Moeller earned an M.B.A. in Finance from Fordham University, where he graduated in 1987. He holds a Bachelor of Arts in Economics from George Washington University.
More Economy in Brief


