 Global| Sep 24 2004
U.S. Durable Goods Orders Down: Aircraft Orders Quite Volatile
by:Tom Moeller
|in:Economy in Brief
Summary
Volatile orders for aircraft & parts dominated the durable goods figures again in August as a 35.1% m/m decline followed a 37.3% July surge. This pulled total durable goods orders down 0.5% last month following a 1.8% jump in July [...]
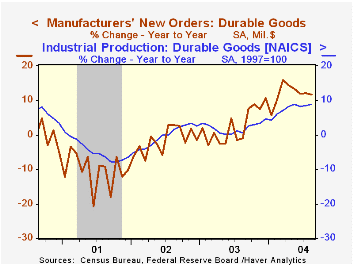
Volatile orders for aircraft & parts dominated the durable goods figures again in August as a 35.1% m/m decline followed a 37.3% July surge. This pulled total durable goods orders down 0.5% last month following a 1.8% jump in July that was little revised. Consensus expectations had been for no change in total August orders. Less aircraft durable orders were quite strong, up 2.5% (11.3% y/y) following a 0.4% decline in July.
Commercial aircraft orders retraced nearly all of the doubling of bookings in July.
The volatility in aircraft orders pulled total nondefense capital goods orders down 7.4%. Less aircraft, capital goods orders still fell 0.5% (11.2% y/y), the fourth monthly decline in the last five.
Orders for computers & electronic products recouped most of a 4.3% decline in July with a 4.1% (+4.3% y/y) August rise. Computer orders only gained back 0.8% (0.3% y/y) of the 5.2% July plunge but orders for communications equipment added 6.8% (1.3% y/y) to the 5.3% July strength. Orders for electrical equipment, appliance & components rose 1.8% (9.2% y/y) after a 6.7% spike in July. Machinery orders were unchanged (17.5% y/y) following moderate gains in the prior three months.
"The Software Patent Experiment" from the Federal Reserve Bank of Philadelphia can be found here.
During the last ten years there has been an 80% correlation between the y/y change in real nonresidential fixed investment in equipment & software and the change in orders for nondefense capital goods. The correlation with shipments has been 93%.
Shipments of durable goods jumped 1.7% (13.4% y/y) following a 0.4% July rise. Shipments excluding the transportation sector, which were pumped by the motor vehicle and the aircraft sectors, rose 0.7% (+14.9% y/y).
Durable inventories rose 0.6% (5.1% y/y) following an upwardly revised 1.1% July spike.
| NAICS Classification | Aug | July | Y/Y | 2003 | 2002 | 2001 |
|---|---|---|---|---|---|---|
| Durable Goods Orders | -0.5% | 1.8% | 11.7% | 2.6% | -1.7% | -10.5% |
| Non-defense Capital Goods | -7.4% | 9.3% | 13.0% | 5.6% | -7.2% | -15.5% |

Tom Moeller
AuthorMore in Author Profile »Prior to joining Haver Analytics in 2000, Mr. Moeller worked as the Economist at Chancellor Capital Management from 1985 to 1999. There, he developed comprehensive economic forecasts and interpreted economic data for equity and fixed income portfolio managers. Also at Chancellor, Mr. Moeller worked as an equity analyst and was responsible for researching and rating companies in the economically sensitive automobile and housing industries for investment in Chancellor’s equity portfolio. Prior to joining Chancellor, Mr. Moeller was an Economist at Citibank from 1979 to 1984. He also analyzed pricing behavior in the metals industry for the Council on Wage and Price Stability in Washington, D.C. In 1999, Mr. Moeller received the award for most accurate forecast from the Forecasters' Club of New York. From 1990 to 1992 he was President of the New York Association for Business Economists. Mr. Moeller earned an M.B.A. in Finance from Fordham University, where he graduated in 1987. He holds a Bachelor of Arts in Economics from George Washington University.
More Economy in Brief


