 Global| Dec 17 2007
U.S. Current Account Deficit Eased Further in Q3
by:Tom Moeller
|in:Economy in Brief
Summary
The US current account deficit fell further last quarter to $178.5 billion from $188.9 billion in Q2, a figure that was revised slightly shallower. The Q3 deficit was shallower than Consensus expectations for a deficit of $183.3 [...]
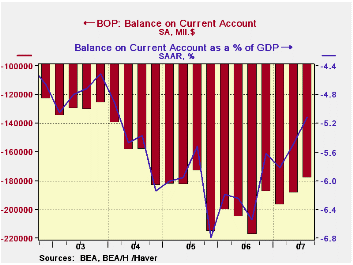
The US current account deficit fell further last quarter to $178.5 billion from $188.9 billion in Q2, a figure that was revised slightly shallower. The Q3 deficit was shallower than Consensus expectations for a deficit of $183.3 billion.
The latest deficit totaled 5.1% of GDP and it peaked as a percentage of GDP nearly two years ago at 6.8% in Q4 2005.
That shrinkage occurred as the deficit on merchandise trade improved slightly $199.7B from Q2's deficit of $204.2B and from its deepest shortfall a year ago of $219.9B During the last year only, exports grew 10.0% and outpaced the 4.4% y/y growth in imports.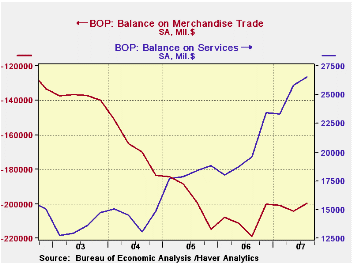
The effects of the lower U.S. dollar and the strength of foreign economies versus the U.S. is apparent most decisively in the surplus in services trade. It improved markedly to a record surplus of $26.5B from $25.8B in 2Q. Exports of services during the last year alone grew 14.3%. Travel exports grew 17.7% y/y, passenger fares were up 10.9% and freight shipping grew 11.3%. Import growth, conversely was contained to 9.2% due to moderate 7.7% growth in travel, 4.8% growth in passenger fares and a slight 1.4% advance in private freight transportation.
Foreign trade zones from the Federal Reserve Bank of Minneapolis can be found here.
| US Balance of Payments, Bil.$, SA |
Q3 2007 | Q2 2007 | Year Ago | 2006 | 2005 | 2004 |
|---|---|---|---|---|---|---|
| Current Account Balance ($ Bil.) | -178.5 | -188.9 | -217.3 | -811.5 | -754.8 | -640.2 |
| Deficit % of GDP | -5.1 | -5.5 | -6.6 | -6.2 | -6.1 | -5.5 |
| Balance on Goods ($ Bil.) | -199.7 | -204.2 | -218.9 | -838.3 | -787.1 | -669.6 |
| Exports | 3.5% | 1.2% | 11.0% | 12.7% | 10.9% | 13.7% |
| Imports | 2.4% | 0.9% | 4.4% | 10.4% | 12.9% | 16.8% |
| Balance on Private Services ($ Bil.) | 26.5 | 25.8 | 19.6 | 79.8 | 72.8 | 57.5 |
| Exports | 2.4% | 5.1% | 14.3% | 9.9% | 10.5% | 14.7% |
| Imports | 2.2% | 3.1% | 9.2% | 9.3% | 8.7% | 16.8% |
| Balance on Income ($ Bil.) | 20.5 | 12.7 | 5.9 | 36.6 | 48.1 | 56.4 |
| Unilateral Transfers ($ Bil.) | -25.8 | -23.2 | -23.9 | -89.6 | -88.5 | -88.4 |

Tom Moeller
AuthorMore in Author Profile »Prior to joining Haver Analytics in 2000, Mr. Moeller worked as the Economist at Chancellor Capital Management from 1985 to 1999. There, he developed comprehensive economic forecasts and interpreted economic data for equity and fixed income portfolio managers. Also at Chancellor, Mr. Moeller worked as an equity analyst and was responsible for researching and rating companies in the economically sensitive automobile and housing industries for investment in Chancellor’s equity portfolio. Prior to joining Chancellor, Mr. Moeller was an Economist at Citibank from 1979 to 1984. He also analyzed pricing behavior in the metals industry for the Council on Wage and Price Stability in Washington, D.C. In 1999, Mr. Moeller received the award for most accurate forecast from the Forecasters' Club of New York. From 1990 to 1992 he was President of the New York Association for Business Economists. Mr. Moeller earned an M.B.A. in Finance from Fordham University, where he graduated in 1987. He holds a Bachelor of Arts in Economics from George Washington University.
More Economy in Brief


