 Global| Dec 14 2007
U.S. CPI Total & Core Slightly Above Expectations
by:Tom Moeller
|in:Economy in Brief
Summary
The consumer price index (CPI-U) rose 0.8% last month due to the surge in energy prices. The gain was the quickest since September of 2005, a month when higher energy prices similarly raised the index.A 0.6% rise in the November CPI [...]
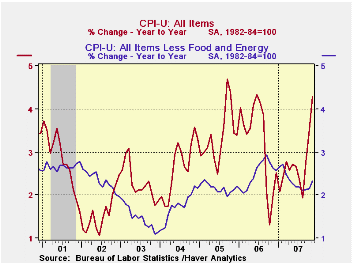
The consumer price index (CPI-U) rose 0.8% last month due to the surge in energy prices. The gain was the quickest since September of 2005, a month when higher energy prices similarly raised the index.A 0.6% rise in the November CPI had been expected by a Consensus of economists. The y/y gain in prices of 4.3% was its quickest since June of last year.
Core consumer price inflation picked up slightly to 0.3% after five months of 0.2% increase. A 0.2% gain was the general expectation. The y/y increase of 2.3% was its quickest in six months and the three month rise, to 2.6% (AR), has shown acceleration this year.
Energy prices soared 5.7%, the fastest rise since a 5.9% increase during March of this year. Those two gains were the quickest since an 11.8% surge in 2005. That was subsequently followed by m/m declines and/or more moderate gains in energy prices. Gasoline prices jumped 9.3% (37.1% y/y) last month but the weekly data already indicate a slight m/m decline in December. Prices for fuel oil & other fuels surged 11.9% (28.4% y/y) but natural gas & electricity prices rose just 0.7% (4.4% y/y). 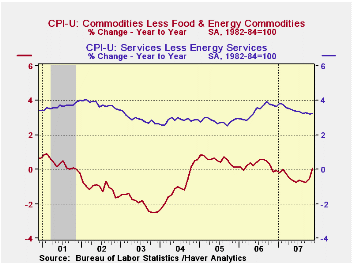
Food & beverage prices rose 0.3% (4.7% y/y) but that was enough to lift the y/y increase to its fastest since 1991. Prices of dairy products were notably strong and rose 0.6% (14.0% y/y). Prices for fruits & vegetable jumped 1.6% (4.5% y/y) but prices for meats, poultry & fish fell 0.1% (5.4% y/y).
Core goods prices rose 0.2% after slight declines during each of the prior three months. Apparel prices surged 0.8% (-0.4% y/y) after having been unchanged in October. New & used motor vehicle prices were unchanged (-0.4% y/y) after two months of decline. Prices of household furnishings & operation rose a slight 0.1% (-0.7% y/y) after four straight months of decline.Tobacco prices increased 0.2% (8.2% y/y) for the second month but the y/y gain was its strongest since early 2003. The core CPI less tobacco rose 0.3% (2.3%).
Core services prices rose 0.3% (3.2% y/y). Shelter prices increased 0.3% (3.1% y/y) and that y/y change was its slowest since early this year. Owners equivalent rent of primary residence, a measure not equivalent to other house price measures, rose 0.3%, reducing the y/y gain to 2.8% y/y. Since a low several months ago of 1.8%, the three month change has picked up to 3.4%, its firmest since January. Public transportation prices rose 1.8% (6.1% y/y) and medical care services prices rose 0.3% (5.8% y/y). Education service prices rose 0.6% (5.5% y/y) after a firm 0.7% October gain but communication prices fell (-0.1% y/y) for the second consecutive month.The chained CPI, which adjusts for shifts in the mix of consumer purchases rose 0.4% (3.6% y/y) but the core measure was unchanged. This latter measure is similar to the core PCE price index but its treatment of housing price differs
A Comparison of Measures of Core Inflation from the Federal Reserve Bank of New York can be found here.
| Consumer Price Index | November | October | September | Y/Y | 2006 | 2005 | 2004 |
|---|---|---|---|---|---|---|---|
| Total | 0.8% | 0.3% | 0.3% | 4.3% | 3.2% | 3.4% | 2.7% |
| Total less Food & Energy | 0.3% | 0.2% | 0.2% | 2.3% | 2.5% | 2.2% | 1.8% |
| Goods less Food & Energy | 0.2% | -0.0% | -0.0% | 0.0% | 0.2% | 0.5% | -0.9% |
| Services less Energy | 0.3% | 0.2% | 0.3% | 3.2% | 3.4% | 2.8% | 2.8% |
| Energy | 5.7% | 1.4% | 0.3% | 21.3% | 11.1% | 16.9% | 10.8% |
| Food & Beverages | 0.3% | 0.3% | 0.5% | 4.8% | 2.3% | 2.4% | 3.4% |
| Chained CPI: Total (NSA) | 0.4% | 0.2% | 0.3% | 3.6% | 2.8% | 2.9% | 2.5% |
| Total less Food & Energy | 0.0% | 0.3% | 0.3% | 2.0% | 2.3% | 1.9% | 1.7% |

Tom Moeller
AuthorMore in Author Profile »Prior to joining Haver Analytics in 2000, Mr. Moeller worked as the Economist at Chancellor Capital Management from 1985 to 1999. There, he developed comprehensive economic forecasts and interpreted economic data for equity and fixed income portfolio managers. Also at Chancellor, Mr. Moeller worked as an equity analyst and was responsible for researching and rating companies in the economically sensitive automobile and housing industries for investment in Chancellor’s equity portfolio. Prior to joining Chancellor, Mr. Moeller was an Economist at Citibank from 1979 to 1984. He also analyzed pricing behavior in the metals industry for the Council on Wage and Price Stability in Washington, D.C. In 1999, Mr. Moeller received the award for most accurate forecast from the Forecasters' Club of New York. From 1990 to 1992 he was President of the New York Association for Business Economists. Mr. Moeller earned an M.B.A. in Finance from Fordham University, where he graduated in 1987. He holds a Bachelor of Arts in Economics from George Washington University.
More Economy in Brief


