 Global| Apr 14 2010
U.S. CPI Increase Is Weak; Core Prices Are Unchanged
by:Tom Moeller
|in:Economy in Brief
Summary
Consumer price inflation remain subdued last month, according to the U.S. Bureau of Labor Statistics. It reported that the CPI during March rose all of 0.1% after having been unchanged during February. That was enough to leave the [...]
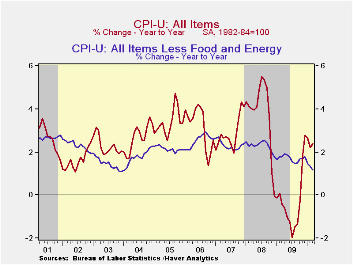
Consumer price inflation remain subdued last month, according to the U.S. Bureau of Labor Statistics. It reported that the CPI during March rose all of 0.1% after having been unchanged during February. That was enough to leave the change during the last three months at 0.9% (AR), its lowest since May of last year. The latest figure matched Consensus expectations.
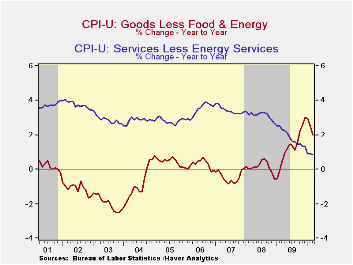
Core consumer prices also were weak. Goods & services together were unchanged while a 0.1% increase had been expected. That pulled the three-month change to negative 0.1% which was its lowest since January 2009. Core goods prices fell 0.1% as they did in February. That was enough to pull the three-month gain to a negative 0.1% versus the high of 5.4% last April. New & used motor vehicles prices posted a 0.2% increase (5.5% y/y). Apparel prices began to fall slightly versus last year while prices for household furnishings & operation fell 2.3% y/y.
Core services prices again inched up 0.1% (+0.9% y/y). Weakness in the housing market caused a 0.5% y/y decline in shelter prices while owners equivalent rent of primary residences, a measure not equivalent to other house price measures, slipped again m/m. A slight y/y decline in this measure was the weakest reading since the series' start in 1983. Elsewhere in services, prices have been relatively strong. Public transportation prices rose 0.5% (6.1% y/y) and medical care services prices gained another 0.3% (3.8% y/y). Finally, education costs posted a strong 0.6% increase (4.9% y/y) but recreation prices slipped for the seventh straight month (-1.1% y/y).
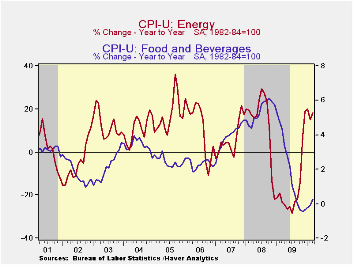
Energy prices slipped slightly again as they reflected a 0.8% m/m decline in gasoline prices. Gas prices are up, however, by 41.4% y/y. Fuel oil prices slipped 1.3% (+19.6% y/y) but natural gas & electricity prices rose a firm 1.4% (-1.8% y/y).
Food & beverage prices firmed a bit by 0.2% but the y/y gain of 0.3% followed six months of price deflation. A 0.4% decline in dairy prices was an improvement from the 10.4% decline last summer. Also showing less deflation were prices for meats, poultry, fish & eggs (-1.7% y/y) but cereal & bakery product prices continued weak (-1.1% y/y). Dairy product prices also showed less deflation (-0.4% y/y) while fruit & bakery products rose 2.1% y/y. Finally, the cost of eating out rose just 1.2%, a record low increase, while alcoholic beverage prices also rose just 1.1% y/y, the least since 1995.
The chained CPI, which adjusts for shifts in consumption patterns improved last month and rose 2.5% year-to-year. Chained prices less food & energy gained 0.8% y/y.
The consumer price data is available in Haver's USECON database while detailed figures can be found in the CPIDATA database.
Has the behavior of inflation and long-term inflation expectations changed? from the Federal Reserve Bank of Kansas City can be found here.
| Consumer Price Index (%) | March | February | January | March y/y | 2009 | 2008 | 2007 |
|---|---|---|---|---|---|---|---|
| Total | 0.1 | 0.0 | 0.2 | 2.4 | -0.3 | 3.8 | 2.9 |
| Total less Food & Energy | 0.0 | 0.1 | -0.1 | 1.2 | 1.7 | 2.3 | 2.3 |
| Goods less Food & Energy | -0.1 | -0.1 | 0.1 | 2.0 | 1.3 | 0.1 | -0.4 |
| Services less Energy | 0.1 | 0.1 | -0.2 | 0.9 | 1.9 | 3.1 | 3.4 |
| Energy | -0.0 | -0.5 | 2.8 | 14.9 | -18.1 | 13.7 | 5.6 |
| Food & Beverages | 0.2 | 0.0 | 0.2 | 0.3 | 1.9 | 5.4 | 3.9 |
| Chained CPI: Total (NSA) | 0.4 | -0.0 | 0.4 | 2.5 | -0.1 | 3.7 | 2.5 |
| Total less Food & Energy | 0.2 | 0.2 | -0.0 | 0.8 | 1.5 | 2.0 | 1.9 |

Tom Moeller
AuthorMore in Author Profile »Prior to joining Haver Analytics in 2000, Mr. Moeller worked as the Economist at Chancellor Capital Management from 1985 to 1999. There, he developed comprehensive economic forecasts and interpreted economic data for equity and fixed income portfolio managers. Also at Chancellor, Mr. Moeller worked as an equity analyst and was responsible for researching and rating companies in the economically sensitive automobile and housing industries for investment in Chancellor’s equity portfolio. Prior to joining Chancellor, Mr. Moeller was an Economist at Citibank from 1979 to 1984. He also analyzed pricing behavior in the metals industry for the Council on Wage and Price Stability in Washington, D.C. In 1999, Mr. Moeller received the award for most accurate forecast from the Forecasters' Club of New York. From 1990 to 1992 he was President of the New York Association for Business Economists. Mr. Moeller earned an M.B.A. in Finance from Fordham University, where he graduated in 1987. He holds a Bachelor of Arts in Economics from George Washington University.
More Economy in Brief


