 Global| May 10 2010
U.S. Consumer Credit Retrenchment Eases
by:Tom Moeller
|in:Economy in Brief
Summary
Consumers have backed away from reducing debt as rapidly as during last year. The Federal Reserve reported late-Friday that consumer credit outstanding rose $2.0B during March following a revised $6.0B February drop. That decline was [...]
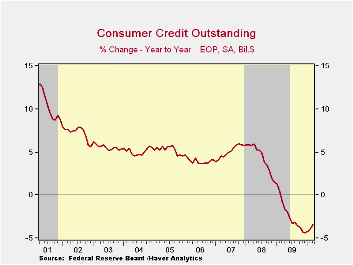 Consumers
have backed away from reducing debt as rapidly as during last year. The
Federal Reserve reported late-Friday that consumer credit outstanding
rose $2.0B during March following a revised $6.0B February drop. That
decline was half the amount reported last month, suggesting that
consumers are more confident about spending. Despite this seeming
stabilization in credit outstanding, the 3.4% y/y decline ending in
March remained a near record.
Consumers
have backed away from reducing debt as rapidly as during last year. The
Federal Reserve reported late-Friday that consumer credit outstanding
rose $2.0B during March following a revised $6.0B February drop. That
decline was half the amount reported last month, suggesting that
consumers are more confident about spending. Despite this seeming
stabilization in credit outstanding, the 3.4% y/y decline ending in
March remained a near record.
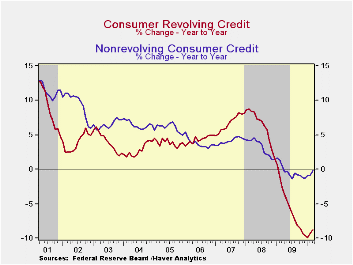
Cutting the usage of revolving
credit remained in the forefront of consumers' pullback. A $3.2B March
decline followed a $6.0B drop and left usage down a near-record 8.8%
y/y. Pools of securitized assets led with a sharp m/m (-84.7% y/y drop.
Finance companies, however, countered and increased lending 29.3% y/y
due to a one month March spike. Commercial bank lending also jumped in
 March
and was up by three- quarters from last year. Loans
from credit unions rose 6.2% y/y while lending by savings institution
increased 4.7%.
March
and was up by three- quarters from last year. Loans
from credit unions rose 6.2% y/y while lending by savings institution
increased 4.7%.
Usage of non-revolving credit (autos & other
consumer durables), which accounts for nearly two-thirds of the total,
actually rose $5.2B after the $0.2B February slip. Non-revolving credit
had fallen modestly during the recession, but has been relatively
stable for a year. Year-to-year figures ending in March show
that Federal government & Sallie Mae lending expanded by nearly
three-quarters while commercial bank lending also rose 6.6%. These
gains were offset a nearly one-half decline in pools of securitized
assets, a 12.9% fall in savings institutions, a 4.3% decline in finance
companies and a 3.1% fall in credit union lending.
During
the last ten years, there has been a 60% correlation between the y/y
change in credit outstanding and the change in personal consumption
expenditures. Moreover, these figures are the major input to
the Fed's quarterly Flow of Funds accounts for the household sector.
Credit data are available in Haver's USECON database. The Flow of Funds data are in Haver's FFUNDS database.
| Consumer Credit Outstanding (m/m Chg, SAAR) | March | February | January | Y/Y | 2009 | 2008 | 2007 |
|---|---|---|---|---|---|---|---|
| Total | $2.0B | $-6.2B | $6.5B | -3.4% | -4.4% | 1.5% | 5.7% |
| Revolving | $-3.2B | $-6.0B | $-4.3B | -8.8% | -9.6% | 1.6% | 8.1% |
| Non-revolving | $5.2B | $-0.2B | $10.8B | -0.2% | -1.3% | 1.5% | 4.4% |

Tom Moeller
AuthorMore in Author Profile »Prior to joining Haver Analytics in 2000, Mr. Moeller worked as the Economist at Chancellor Capital Management from 1985 to 1999. There, he developed comprehensive economic forecasts and interpreted economic data for equity and fixed income portfolio managers. Also at Chancellor, Mr. Moeller worked as an equity analyst and was responsible for researching and rating companies in the economically sensitive automobile and housing industries for investment in Chancellor’s equity portfolio. Prior to joining Chancellor, Mr. Moeller was an Economist at Citibank from 1979 to 1984. He also analyzed pricing behavior in the metals industry for the Council on Wage and Price Stability in Washington, D.C. In 1999, Mr. Moeller received the award for most accurate forecast from the Forecasters' Club of New York. From 1990 to 1992 he was President of the New York Association for Business Economists. Mr. Moeller earned an M.B.A. in Finance from Fordham University, where he graduated in 1987. He holds a Bachelor of Arts in Economics from George Washington University.
More Economy in Brief


