 Global| Sep 01 2005
U.S. Construction Spending Losing Steam
by:Tom Moeller
|in:Economy in Brief
Summary
The value of construction put in place dipped slightly in July following a 0.6% decline in June, although figures for May were revised sharply higher. Consensus expectations had been for a 0.5% increase. Private residential building [...]
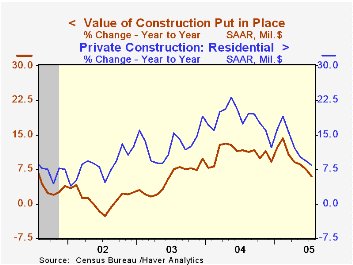
The value of construction put in place dipped slightly in July following a 0.6% decline in June, although figures for May were revised sharply higher. Consensus expectations had been for a 0.5% increase.
Private residential building activity rose slightly as did the value of residential building. New single family building rose 0.1% (9.0% y/y) following gains of 1.0% and 1.3% during the prior two months. The y/y growth in residential building is down by more than half from the peak growth rates of 2004.
Nonresidential building rose 0.2% following the downwardly revised 1.6% June decline but office construction (-1.0% y/y) fell hard for the third straight month.
Public construction spending fell for the second consecutive month as construction activity on highways & streets, nearly one third of the value of public construction spending, fell 2.4% (+7.0% y/y) for the fifth decline this year. While states' spending on highways & streets is up 8.0% y/y, federal spending is down by more than half versus last year.
These more detailed categories represent the Census Bureau’s reclassification of construction activity into end-use groups. Finer detail is available for many of the categories; for instance, commercial construction is shown for Automotive sales and parking facilities, drugstores, building supply stores, and both commercial warehouses and mini-storage facilities. Note that start dates vary for some seasonally adjusted line items in 2000 and 2002 and that constant-dollar data are no longer computed.
| Construction Put-in-place | July | June | Y/Y | 2004 | 2003 | 2002 |
|---|---|---|---|---|---|---|
| Total | -0.0% | -0.6% | 6.0% | 10.9% | 5.4% | 1.0% |
| Private | 0.2% | -0.6% | 6.6% | 13.6% | 6.3% | -0.4% |
| Residential | 0.2% | -0.2% | 8.5% | 18.2% | 12.9% | 8.5% |
| Nonresidential | 0.2% | -1.6% | 2.0% | 3.9% | -5.4% | -13.0% |
| Public | -0.8% | -0.6% | 3.9% | 2.5% | 2.7% | 5.7% |
by Tom Moeller September 1, 2005
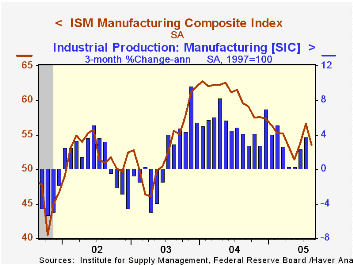
The Composite Index of activity in the manufacturing sector, reported by the Institute of Supply Management, backpedaled three points in August to 53.6 following a like-sized increase in July. The decline outpaced Consensus expectations for a modest increase to 57.0. (In light of this week's published decline in the Chicago PMI, Consensus expectations may have ratcheted down.)
During the last twenty years there has been a 64% correlation between the level of the Composite Index and the three month growth in factory sector industrial production.
Pricing in the factory sector firmed to the strongest since April. The prices paid index rose to 62.5 following three months of decline.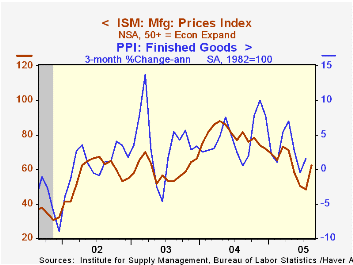
Production gave back nearly all of the prior month's gain with a 5.3 drop. Likewise, the new orders index fell 4.2 points and reversed more than all of the July increase as the export order index also fell. Inventory restocking eased as the inventory index fell for the second month to the lowest level since October 2003.
The rate of job creation eased slightly in August though the index level of 52.6 continued to indicate positive growth. During the last twenty years there has been a 67% correlation between the level of the ISM Employment Index and the three month growth in factory sector employment.
| ISM Manufacturing Survey | Aug | July | Aug '04 | 2004 | 2003 | 2002 |
|---|---|---|---|---|---|---|
| Composite Index | 53.6 | 56.6 | 59.6 | 60.5 | 53.3 | 52.4 |
| New Orders Index | 56.4 | 60.6 | 62.2 | 63.5 | 57.9 | 56.5 |
| Prices Paid Index (NSA) | 62.5 | 48.5 | 81.5 | 79.8 | 59.6 | 57.6 |
by Tom Moeller September 1, 2005
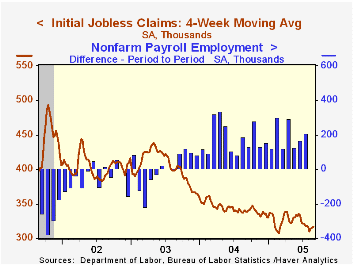
Initial claims for unemployment insurance rose 3,000 last week to 320,000 and reversed the prior week's revised 2,000 decline. Consensus expectations had been for 315,000 claims.
The latest figure should have little bearing on Consensus expectations for a 190,000 increase in August nonfarm payrolls, to be reported tomorrow morning by the Bureau of Labor Statistics.
The four-week moving average of initial claims rose slightly to 316,750 (-7.0% y/y).
Continuing claims for unemployment insurance rose 36,000 in the latest week to the highest level since early July.
For the seventh consecutive week, the insured unemployment rate remained at its four-year low of 2.0%.
| Unemployment Insurance (000s) | 08/27/05 | 08/20/05 | Y/Y | 2004 | 2003 | 2002 |
|---|---|---|---|---|---|---|
| Initial Claims | 320 | 317 | -9.6% | 343 | 402 | 404 |
| Continuing Claims | -- | 2,607 | -9.0% | 2,926 | 3,531 | 3,570 |
by Tom Moeller September 1, 2005
Personal income rose just 0.3% in July following an unrevised 0.5% increase in June. Consensus expectations had been for a 0.5% increase. Combined with a similarly modest gain in May, the three-month growth in income slowed to 4.4% (AR) from 6.9% in January.
The Trimmed-Mean PCE Inflation rate reflects new research from the Federal Reserve Bank of Dallas. The measure indicates that core price inflation may be running one-half of a percentage faster than what is being indicated by other measures. It is now available in USECON and the Dallas Fed's research is available here.
The PCE chain price index, from the US Bureau of Economic Analysis, rose 0.3% following a June dip. Gasoline prices rose 6.1% after two months of decline and rose another 8.6% in August. Less food & energy, prices ticked just 0.1% higher following no change in June.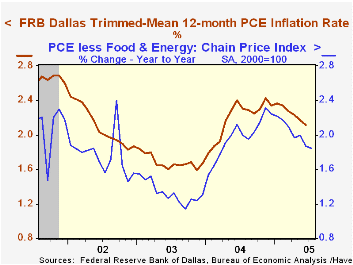
Wages & salaries rose 0.5% (6.9% y/y), the strongest monthly increase since April. Factory sector wages rose 0.5% (5.7% y/y) and prior month's figures were revised up. Sector wages rose 0.6% (8.0% y/y), the strongest since April.
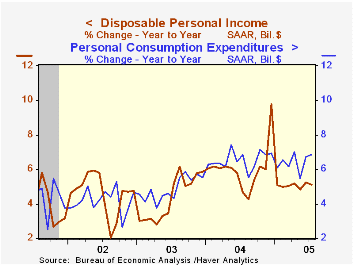
Disposable personal income increased 0.3% (5.1% y/y) after a 0.5% June increase. Adjusted for price inflation take home pay was unchanged (2.5% y/y), the first month of no growth since March.
Personal consumption expenditures surged another 1.0% owing to a 10.6% jump in sales of light vehicles. That followed a 7.5% spike in June vehicle sales. Spending on durables overall rose 4.7% (9.4% y/y) and nondurables spending rose 0.6% (8.0% y/y). Services spending increased 0.4% (5.7% y/y).
The personal savings rate went negative for the first time since 2001 although the household sector's net worth (from the Flow of Funds Accounts) has been rising, helped by a 16% increase in owners' equity in real estate.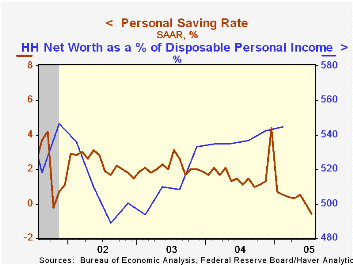
Understanding the Term Structure of Interest Rates from the Federal Reserve Bank of St. Louis is available here.
| Disposition of Personal Income | July | June | Y/Y | 2004 | 2003 | 2002 |
|---|---|---|---|---|---|---|
| Personal Income | 0.3% | 0.5% | 6.3% | 5.9% | 3.2% | 1.8% |
| Personal Consumption | 1.0% | 1.0% | 6.9% | 6.5% | 4.9% | 4.2% |
| Savings Rate | -0.6% | 0.0% | 1.1% | 1.7% | 2.1% | 2.4% |
| PCE Chain Price Index | 0.3% | -0.0% | 2.5% | 2.6% | 1.9% | 1.4% |
| Less food & energy | 0.1% | 0.0% | 1.8% | 2.0% | 1.3% | 1.8% |

Tom Moeller
AuthorMore in Author Profile »Prior to joining Haver Analytics in 2000, Mr. Moeller worked as the Economist at Chancellor Capital Management from 1985 to 1999. There, he developed comprehensive economic forecasts and interpreted economic data for equity and fixed income portfolio managers. Also at Chancellor, Mr. Moeller worked as an equity analyst and was responsible for researching and rating companies in the economically sensitive automobile and housing industries for investment in Chancellor’s equity portfolio. Prior to joining Chancellor, Mr. Moeller was an Economist at Citibank from 1979 to 1984. He also analyzed pricing behavior in the metals industry for the Council on Wage and Price Stability in Washington, D.C. In 1999, Mr. Moeller received the award for most accurate forecast from the Forecasters' Club of New York. From 1990 to 1992 he was President of the New York Association for Business Economists. Mr. Moeller earned an M.B.A. in Finance from Fordham University, where he graduated in 1987. He holds a Bachelor of Arts in Economics from George Washington University.
More Economy in Brief


