 Global| Oct 01 2008
U.S. Construction Spending in August Unchanged M/M, Down 5.9% Y/Y
by:Tom Moeller
|in:Economy in Brief
Summary
The value of construction put in place was unchanged during August but the decline in July was revised doubled to 1.4%. The decline for August compared to expectations for a slight, 0.5% drop. Year-to-year, the decline in construction [...]
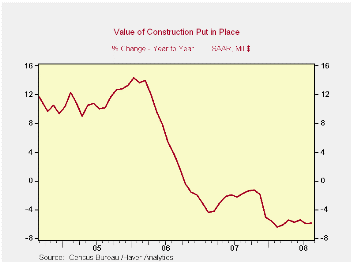
The value of construction put in place was unchanged during August but the decline in July was revised doubled to 1.4%. The decline for August compared to expectations for a slight, 0.5% drop.
Year-to-year, the decline in construction activity remained steady at a -5.9% pace, and the level of activity so far this year has been roughly stable.
The value of nonresidential building activity led the weakness in building activity during August. It fell 0.8% after a downwardly revised 1.1% drop during July. Several categories posted m/m declines, notably transportation which fell 2.1% (+3.9% y/y). Commercial construction fell 0.6% (-4.9% y/y) while spending on health care facilities drpped again, during August by 0.8% (+4.9% y/y). Office construction continued firm and increased 1.0% (10.6% y/y). Lodging spending rose another 2.1% (29.3% y/y) while spending on multi-retail building rose 2.7% (2.1% y/y).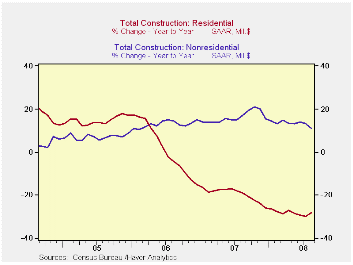
Residential building activity steadied after many months of sharp decline. The steadiness was due to a 9.8% (-8.4% y/y) jump in spending on home improvements. Single-family construction dropped another 4.2% (-41.1% y/y) and that level is off by two-thirds from its peak in early 2006. Building activity on multi-family units fell 4.2% (-4.3% y/y).
During the last twenty years there has been an 84% correlation between the q/q change in the value of residential building and its contribution to growth in real GDP.
Public construction continued firm and rose 0.8% (7.7% y/y). The value of construction spending on highways & streets recovered 3.9% (7.3% y/y). (The value of construction on highways & streets is roughly one third of the value of total public construction spending.) Building activity of office space was quite firm and rose 2.0% (24.7% y/y). Spending on health care facilities rose 7.3% (3.6% y/y).
The more detailed categories of construction represent the Census Bureau’s reclassification of construction activity into end-use groups. Finer detail is available for many of the categories; for instance, commercial construction is shown for automotive sales and parking facilities, drugstores, building supply stores, and both commercial warehouses and mini-storage facilities. Note that start dates vary for some seasonally adjusted line items in 2000 and 2002 and that constant-dollar data are no longer computed.
| Construction (%) | August | July | Y/Y | 2007 | 2006 | 2005 |
|---|---|---|---|---|---|---|
| Total | 0.0 | -1.4 | -5.9 | -2.7 | 6.3 | 11.2 |
| Private | -0.3 | -2.4 | -10.5 | -6.9 | 5.5 | 12.7 |
| Residential | 0.3 | -3.9 | -28.4 | -19.8 | 1.0 | 14.9 |
| Nonresidential | -0.8 | -1.1 | 13.0 | 19.6 | 16.2 | 7.8 |
| Public | 0.8 | 1.3 | 7.7 | 12.3 | 9.3 | 6.2 |

Tom Moeller
AuthorMore in Author Profile »Prior to joining Haver Analytics in 2000, Mr. Moeller worked as the Economist at Chancellor Capital Management from 1985 to 1999. There, he developed comprehensive economic forecasts and interpreted economic data for equity and fixed income portfolio managers. Also at Chancellor, Mr. Moeller worked as an equity analyst and was responsible for researching and rating companies in the economically sensitive automobile and housing industries for investment in Chancellor’s equity portfolio. Prior to joining Chancellor, Mr. Moeller was an Economist at Citibank from 1979 to 1984. He also analyzed pricing behavior in the metals industry for the Council on Wage and Price Stability in Washington, D.C. In 1999, Mr. Moeller received the award for most accurate forecast from the Forecasters' Club of New York. From 1990 to 1992 he was President of the New York Association for Business Economists. Mr. Moeller earned an M.B.A. in Finance from Fordham University, where he graduated in 1987. He holds a Bachelor of Arts in Economics from George Washington University.
More Economy in Brief


