 Global| Oct 01 2014
U.S. Construction Spending Eases
by:Tom Moeller
|in:Economy in Brief
Summary
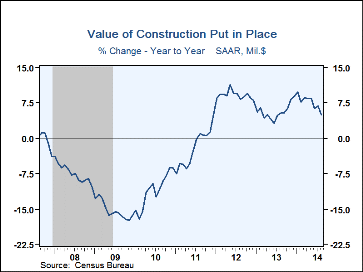
The value of construction put-in-place edged 0.8% lower (+5.0% y/y) during August following a 1.2% July increase. During the last five months, the value of construction spending has been little changed. The latest increase [...]
The value of construction put-in-place edged 0.8% lower (+5.0% y/y) during August following a 1.2% July increase. During the last five months, the value of construction spending has been little changed. The latest increase disappointed expectations for a 0.3% rise in the Action Economics Forecast Survey.
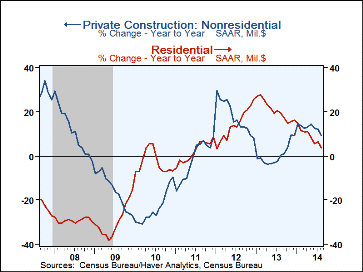
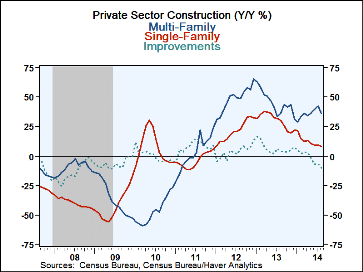
Private sector construction outlays fell 0.8% in August (+6.3% y/y) and reversed a 0.9% July gain. Nonresidential building led the drop with a 1.4% shortfall. It reflected a 3.5% decline (+0.2% y/y) in commercial building and a 1.0% drop (+18.6% y/y) in office construction. Residential building slipped 0.1% (+3.7% y/y), continuing the significant slowdown in momentum since early-2013. Single-family homebuilding edged 0.7% higher (+8.3% y/y) after a 0.8% increase, but y/y growth of 8.3% was down from 35.0% y/y early-last year. Multi-family building improved 1.4%. Momentum here also was off markedly. Year-to-year growth of 35.9% was roughly half that of late-2012. Spending on improvements fell 2.0% in August, the seventh month of decline this year. The year-to-year decline of 10.3% compared to the peak of +16.4% y/y early last year.
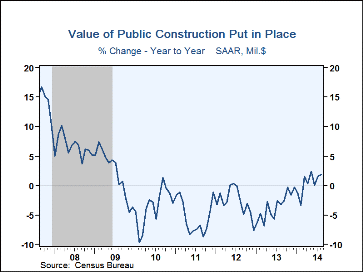
The forward momentum behind public sector building activity has firmed. Despite the 0.9% August decline, the y/y advance of 1.9% compared to negative growth extending back to 2009. Office building is up 20.2% y/y compared to a one-quarter decline last year and 2.9% y/y growth in spending on education compared to a 9.8% decline last year. Countering these gains was 0.1% slip in spending on highways & streets.
The construction spending figures are in Haver's USECON database and the expectations figure is contained in the AS1REPNA database.
Tom Moeller
AuthorMore in Author Profile »Prior to joining Haver Analytics in 2000, Mr. Moeller worked as the Economist at Chancellor Capital Management from 1985 to 1999. There, he developed comprehensive economic forecasts and interpreted economic data for equity and fixed income portfolio managers. Also at Chancellor, Mr. Moeller worked as an equity analyst and was responsible for researching and rating companies in the economically sensitive automobile and housing industries for investment in Chancellor’s equity portfolio. Prior to joining Chancellor, Mr. Moeller was an Economist at Citibank from 1979 to 1984. He also analyzed pricing behavior in the metals industry for the Council on Wage and Price Stability in Washington, D.C. In 1999, Mr. Moeller received the award for most accurate forecast from the Forecasters' Club of New York. From 1990 to 1992 he was President of the New York Association for Business Economists. Mr. Moeller earned an M.B.A. in Finance from Fordham University, where he graduated in 1987. He holds a Bachelor of Arts in Economics from George Washington University.
More Economy in Brief
 Global| Feb 05 2026
Charts of the Week: Balanced Policy, Resilient Data and AI Narratives
by:Andrew Cates


