 Global| Sep 05 2006
U.S. Construction Spending Drop Largest Since 2001
by:Tom Moeller
|in:Economy in Brief
Summary
In July, the value of construction put in place dropped 1.2% following a little revised 0.4% gain during June. Consensus expectations had been for a 0.1% decline. The m/m drop was the largest since July 2001 and lowered the opening [...]
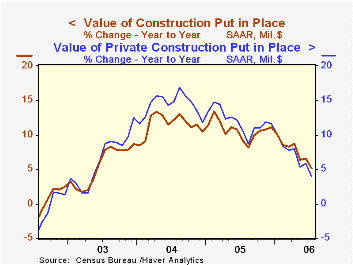
In July, the value of construction put in place dropped 1.2% following a little revised 0.4% gain during June. Consensus expectations had been for a 0.1% decline. The m/m drop was the largest since July 2001 and lowered the opening level for 3Q spending 1.0% below the 2Q average.
The 2.0% July drop in residential building activity was an accelerated rate of decline versus the 1.0% to 1.6% range of monthly shortfalls during the prior three months. New single family building collapsed 3.0% (-6.0% y/y) and the July level was down 9.9% from the peak in February. Moving in the other direction, spending on multi-family projects rose 1.6% (14.9% y/y) but the value of spending on improvements fell 0.8% (-0.2% y/y).
During the last twenty years there has been an 84% correlation between the q/q change in the value of residential building and its contribution to growth in real GDP. During April and May the value of residential building activity was down 1.3% from the 1Q average.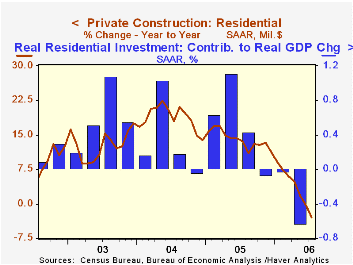
Nonresidential building ticked up 0.3% following strong monthly gains which have now lifted spending by roughly one quarter since the low last year. Office construction surged 5.5% (29.3% y/y) while multi-retail building increased another 3.0% (38.6% y/y). Building by the factory sector fell 3.1% (+26.3% y/y).
Public construction spending fell 0.7%. Construction activity on highways & streets, nearly one third of the value of public construction spending, fell by 0.6% (+18.2% y/y), the second consecutive monthly decline.
These more detailed categories represent the Census Bureau’s reclassification of construction activity into end-use groups. Finer detail is available for many of the categories; for instance, commercial construction is shown for Automotive sales and parking facilities, drugstores, building supply stores, and both commercial warehouses and mini-storage facilities. Note that start dates vary for some seasonally adjusted line items in 2000 and 2002 and that constant-dollar data are no longer computed.
Recent Trends in Homeownership from the Federal Reserve Bank of St. Louis can be found here.
| Construction Put-in-place | July | June | Y/Y | 2005 | 2004 | 2003 |
|---|---|---|---|---|---|---|
| Total | -1.2% | 0.4% | 5.1% | 10.7% | 11.5% | 5.6% |
| Private | -1.3% | 0.4% | 4.0% | 12.0% | 14.3% | 6.4% |
| Residential | -2.0% | -1.0% | 3.0% | 13.9% | 18.6% | 12.8% |
| Nonresidential | 0.3% | 3.7% | 22.0% | 7.4% | 5.3% | -4.8% |
| Public | -0.7% | 0.4% | 9.5% | 6.2% | 2.8% | 2.9% |

Tom Moeller
AuthorMore in Author Profile »Prior to joining Haver Analytics in 2000, Mr. Moeller worked as the Economist at Chancellor Capital Management from 1985 to 1999. There, he developed comprehensive economic forecasts and interpreted economic data for equity and fixed income portfolio managers. Also at Chancellor, Mr. Moeller worked as an equity analyst and was responsible for researching and rating companies in the economically sensitive automobile and housing industries for investment in Chancellor’s equity portfolio. Prior to joining Chancellor, Mr. Moeller was an Economist at Citibank from 1979 to 1984. He also analyzed pricing behavior in the metals industry for the Council on Wage and Price Stability in Washington, D.C. In 1999, Mr. Moeller received the award for most accurate forecast from the Forecasters' Club of New York. From 1990 to 1992 he was President of the New York Association for Business Economists. Mr. Moeller earned an M.B.A. in Finance from Fordham University, where he graduated in 1987. He holds a Bachelor of Arts in Economics from George Washington University.
More Economy in Brief


