 Global| Apr 03 2006
U.S. Construction Rose
by:Tom Moeller
|in:Economy in Brief
Summary
After a lackluster performance during January, the February value of construction put in place rose 0.8%, double the upwardly revised gain the prior month. Consensus expectations had been for a 0.5% increase. Residential building [...]
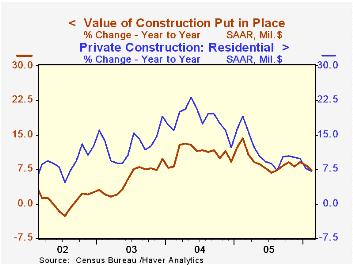
After a lackluster performance during January, the February value of construction put in place rose 0.8%, double the upwardly revised gain the prior month. Consensus expectations had been for a 0.5% increase.
Residential building surged 1.3% after an unrevised 0.1% January up tick. New single family building ballooned 1.3% (14.0% y/y) and the value of improvements rose 1.9% (-10.2% y/y), recovering all of the prior month's decline.
Your House Just Doubled in Value? Don't Uncork the Champagne Just Yet! from the Federal Reserve Bank of Philadelphia is available here.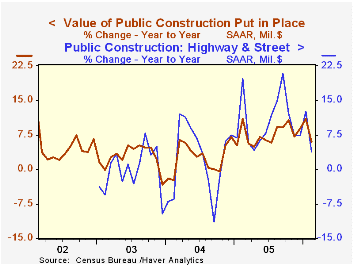
Nonresidential building gained 0.8%. Office construction jumped again, by 1.5% (16.1% y/y), and the previously reported slip during January was revised to an increase of 2.1%. Commercial building, however, fell 2.1% (+11.2% y/y) following much strength during the final nine months of 2005.
Public construction spending slipped 0.5%. Construction activity on highways & streets, nearly one third of the value of public construction spending, rose a modest 0.7% (3.8% y/y).
These more detailed categories represent the Census Bureau’s reclassification of construction activity into end-use groups. Finer detail is available for many of the categories; for instance, commercial construction is shown for Automotive sales and parking facilities, drugstores, building supply stores, and both commercial warehouses and mini-storage facilities. Note that start dates vary for some seasonally adjusted line items in 2000 and 2002 and that constant-dollar data are no longer computed.
| Construction Put-in-place | Feb | Jan | Y/Y | 2005 | 2004 | 2003 |
|---|---|---|---|---|---|---|
| Total | 0.8% | 0.4% | 7.4% | 9.2% | 10.9% | 5.4% |
| Private | 1.2% | 0.4% | 7.8% | 9.7% | 13.6% | 6.3% |
| Residential | 1.3% | 0.1% | 7.1% | 11.5% | 18.2% | 12.9% |
| Nonresidential | 0.8% | 1.2% | 9.6% | 5.4% | 3.9% | -5.4% |
| Public | -0.5% | 0.6% | 6.0% | 7.6% | 2.5% | 2.7% |

Tom Moeller
AuthorMore in Author Profile »Prior to joining Haver Analytics in 2000, Mr. Moeller worked as the Economist at Chancellor Capital Management from 1985 to 1999. There, he developed comprehensive economic forecasts and interpreted economic data for equity and fixed income portfolio managers. Also at Chancellor, Mr. Moeller worked as an equity analyst and was responsible for researching and rating companies in the economically sensitive automobile and housing industries for investment in Chancellor’s equity portfolio. Prior to joining Chancellor, Mr. Moeller was an Economist at Citibank from 1979 to 1984. He also analyzed pricing behavior in the metals industry for the Council on Wage and Price Stability in Washington, D.C. In 1999, Mr. Moeller received the award for most accurate forecast from the Forecasters' Club of New York. From 1990 to 1992 he was President of the New York Association for Business Economists. Mr. Moeller earned an M.B.A. in Finance from Fordham University, where he graduated in 1987. He holds a Bachelor of Arts in Economics from George Washington University.


