 Global| Oct 15 2007
U.S. Budget Deficit Narrowed Sharply
by:Tom Moeller
|in:Economy in Brief
Summary
For Fiscal Year 2007, the U.S. government's budget deficit narrowed sharply to 162.8B versus a deficit during FY 2006 of 248.2B. For the third consecutive year, the deficit's narrowing occurred as revenue growth surged ahead of [...]
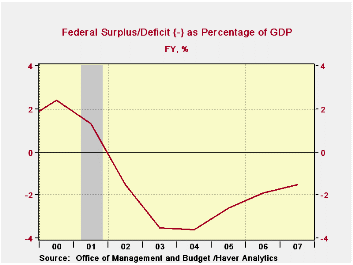
For Fiscal Year 2007, the U.S. government's budget deficit narrowed sharply to 162.8B versus a deficit during FY 2006 of 248.2B. For the third consecutive year, the deficit's narrowing occurred as revenue growth surged ahead of outlays.
As a percentage of GDP the budget deficit last year totaled roughly 1.5%, down sharply from 3.6% in 2004. Receipts rose sharply to 18.8% of GDP, about equal to the long term average.
For forecasts of the deficit in coming fiscal years, the administration's latest Midsession Review of the Budget can be found here.
The Government's financial data is available in Haver's USECON database. 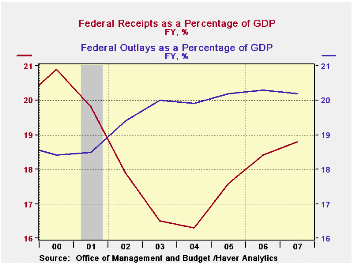
Net revenues last fiscal year grew 6.7% y/y, quite a slowdown from 11.8% growth during FY06. Growth in individual income tax receipts (44% of total receipts), however, held firm at 11.5%. Withheld taxes grew 9.4% during FY07 but non-withheld taxes rose a much stronger 13.0% due to estimated capital gains. Corporate income taxes (13% of total receipts) lagged and rose just 4.6% while a slowdown in employment growth raised employment contributions by just 4.3% versus a 5.7% gain during FY06 and 8.5% during FY05.
U.S. net outlays grew just 2.8% during last fiscal year, a slowdown from 7.4% during FY06. Defense spending (19% of total outlays) picked up a bit and rose 6.1%. Medicare expenditures (12% of outlays) again surged by 13.8% after a 10.5% jump during FY06. Social security spending (21% of outlays) picked up slightly to 6.9% but growth in the government's interest expense declined to rose by 5.0% y/y.
| US Government Finance | September | July | Y/Y | FY 2007 | FY 2006 | FY 2005 |
|---|---|---|---|---|---|---|
| Budget Balance | $111.6B | $-117.0B | $56.2B (9/06) |
-$162.8B | -$248.2B | -$318.7B |
| Net Revenues | $285.4B | $166.5B | 0.7% | 6.7% | 11.8% | 14.1% |
| Net Outlays | $173.8B | $283.5B | -23.5% | 2.8% | 7.4% | 7.6% |

Tom Moeller
AuthorMore in Author Profile »Prior to joining Haver Analytics in 2000, Mr. Moeller worked as the Economist at Chancellor Capital Management from 1985 to 1999. There, he developed comprehensive economic forecasts and interpreted economic data for equity and fixed income portfolio managers. Also at Chancellor, Mr. Moeller worked as an equity analyst and was responsible for researching and rating companies in the economically sensitive automobile and housing industries for investment in Chancellor’s equity portfolio. Prior to joining Chancellor, Mr. Moeller was an Economist at Citibank from 1979 to 1984. He also analyzed pricing behavior in the metals industry for the Council on Wage and Price Stability in Washington, D.C. In 1999, Mr. Moeller received the award for most accurate forecast from the Forecasters' Club of New York. From 1990 to 1992 he was President of the New York Association for Business Economists. Mr. Moeller earned an M.B.A. in Finance from Fordham University, where he graduated in 1987. He holds a Bachelor of Arts in Economics from George Washington University.
More Economy in Brief


