 Global| Apr 10 2014
U.S. Budget Deficit Continues On A Downward Trajectory
by:Tom Moeller
|in:Economy in Brief
Summary
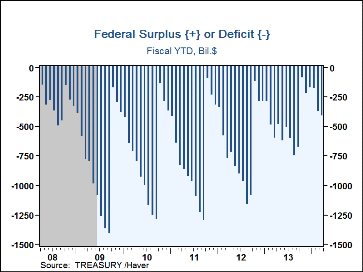
The Federal Government posted a $36.9 billion budget deficit during March of FY 2014. The latest deficit was shallower than the Action Economics Forecast Survey expectation of an $80.0 billion deficit. In the first half of this fiscal [...]
 The Federal Government posted a $36.9 billion budget deficit during
March of FY 2014. The latest deficit was shallower than the Action
Economics Forecast Survey expectation of an $80.0 billion deficit. In the
first half of this fiscal year, the deficit total of $413.3 billion
compares to $600.5 billion last year. It was the smallest budget deficit
during the first six months of any fiscal year since 2008. The latest
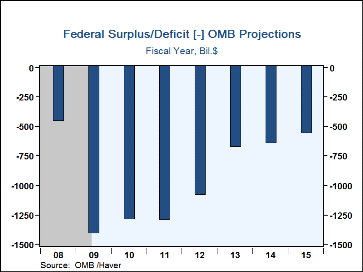
projection from the Office of Management and Budget calls for a deficit of
$648.8 billion this year compared to $680 billion last year.
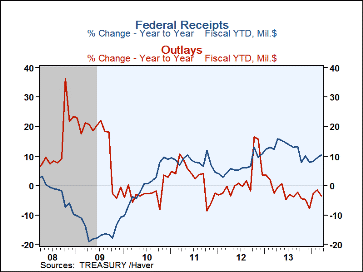
The smaller budget deficit so far this fiscal year reflects a 10.4% y/y rise in total revenues. Corporate income taxes increased 17.2% y/y while the improved labor market raised social insurance taxes by 14.0% y/y. Individual income taxes increased a lesser 5.3% y/y and excise taxes declined 1.2% y/y.
On the spending side, net outlays fell 3.5% so far this fiscal year versus last year. Outlays were led lower by a 6.2% y/y reduction in defense outlays, a 2.7% y/y falloff in interest payments and a 2.6% decline in income security payments. Working the other way, veterans benefits programs payments increased 10.8% y/y, health program outlays increased 9.5% y/y and social security payments rose 4.6% y/y. Medicare outlays were unchanged so far this fiscal year versus last.
Haver's basic data on Federal Government outlays and receipts, and summary presentations of the Budget from both OMB and CBO are contained in USECON. Considerable detail is given in the separate GOVFIN database.
| US Government Finance | Mar | FY'13 | FY'12 | FY'11 | FY'10 | |
|---|---|---|---|---|---|---|
| Budget Balance | -- | $-36.9 bil. | $-680.3 bil. | $-1,089.2 bil. | $-1,296.8 bil. | $-1,294.2 bil. |
| As a percent of GDP | -- | -- | 4.1 | 6.8 | 8.4 | 8.8 |
| % of Total | YTD FY'14 | |||||
| Net Revenues (Y/Y % Change) | 100 | 10.4% | 13.3% | 6.4% | 6.5% | 2.7% |
| Individual Income Taxes | 47 | 5.3 | 16.3 | 3.7 | 21.5 | -1.8 |
| Corporate Income Taxes | 10 | 17.2 | 12.9 | 33.8 | -5.4 | 38.5 |
| Social Insurance Taxes | 34 | 14.0 | 12.1 | 3.2 | -5.3 | -2.9 |
| Excise Taxes | 3 | -1.2 | 6.3 | 9.2 | 8.2 | 7.1 |
| Net Outlays (Y/Y % Change) | 100 | -3.5 | -2.4 | -1.7 | 4.1 | -1.8 |
| National Defense | 18 | -6.2 | -6.3 | -3.9 | 1.7 | 4.6 |
| Health | 10 | 9.5 | 3.1 | -7.0 | 1.0 | 10.4 |
| Medicare | 14 | 0.0 | 5.5 | -2.8 | 7.5 | 5.0 |
| Income Security | 16 | -2.6 | -1.1 | -9.1 | -4.1 | 16.7 |
| Social Security | 24 | 4.6 | 5.2 | 5.8 | 3.4 | 3.5 |
| Veterans Benefits | 4 | 10.8 | 11.5 | -2.0 | 17.3 | 13.6 |
| Interest | 6 | -2.7 | 0.4 | -3.0 | 15.8 | 2.9 |
Tom Moeller
AuthorMore in Author Profile »Prior to joining Haver Analytics in 2000, Mr. Moeller worked as the Economist at Chancellor Capital Management from 1985 to 1999. There, he developed comprehensive economic forecasts and interpreted economic data for equity and fixed income portfolio managers. Also at Chancellor, Mr. Moeller worked as an equity analyst and was responsible for researching and rating companies in the economically sensitive automobile and housing industries for investment in Chancellor’s equity portfolio. Prior to joining Chancellor, Mr. Moeller was an Economist at Citibank from 1979 to 1984. He also analyzed pricing behavior in the metals industry for the Council on Wage and Price Stability in Washington, D.C. In 1999, Mr. Moeller received the award for most accurate forecast from the Forecasters' Club of New York. From 1990 to 1992 he was President of the New York Association for Business Economists. Mr. Moeller earned an M.B.A. in Finance from Fordham University, where he graduated in 1987. He holds a Bachelor of Arts in Economics from George Washington University.
More Economy in Brief
 Global| Feb 05 2026
Charts of the Week: Balanced Policy, Resilient Data and AI Narratives
by:Andrew Cates


