 Global| Jan 13 2009
U.S. Budget Deficit Continued To Swell Toward A Record
by:Tom Moeller
|in:Economy in Brief
Summary
The U.S. government's budget deficit for December continued to reflect the combined effects of a U.S. recession as well as wars in Iraq and Afghanistan.The monthly deficit rose to $83.6 billion. While not large, it compares to a usual [...]
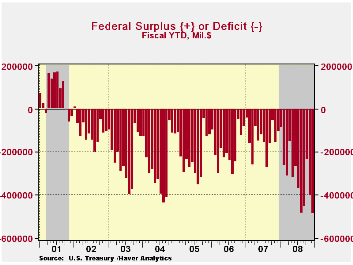
The U.S. government's budget deficit for December continued to reflect the combined effects of a U.S. recession as well as wars in Iraq and Afghanistan.The monthly deficit rose to $83.6 billion. While not large, it compares to a usual budget surplus for December. For the first quarter of this fiscal year the government's budget deficit totaled $485.2B, four times that of last fiscal year's first quarter. Consensus projections were for a December deficit of $63.8B.
Many forecasts for the budget deficit during all of this fiscal year are near $700B. If realized, that would swell the deficit to about 5% of GDP following last year's roughly 3.2% and FY07's marginal 1.2%.The recent estimate from the Congressional Budget Office is for a much higher deficit this year of $1.2 trillion, or 8.3% of GDP.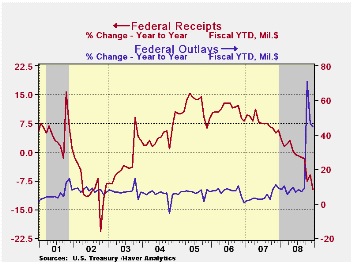
Net revenues during December fell 14.1% from last year and for the first fiscal quarter were down 9.7%. Individual income tax receipts reflected lower employment levels and for 1Q fell 6.7% year-to-year. Corporate tax receipts were hit even harder and they fell 45.6%. Growth in unemployment and social insurance taxes grew just 0.9%, the least since late 2003.
U.S. government outlays surged by nearly one-half from last year's first fiscal quarter. Defense spending (19% of total outlays) rose 9.9%. The gain does not reflect the full cost of the resources devoted to Iraq & Afghanistan since much of the spending would have occurred anyway. Medicare expenditures (12% of outlays) rose by 13.1% and social security spending (21% of outlays) rose 5.5% after 6.8% growth last year. "Income security" payments jumped 18.1% but net interest payments fell 11.8% y/y with lower interest rates.
The Budget and Economic Outlook: Fiscal Years 2009 to 2019 from the Congressional Budget Office can be found here.
The Government's financial data are available in Haver's USECON database, with extensive detail available in the specialized GOVFIN.
| US Government Finance | December | November | Y/Y | FY 2008 | FY 2007 | FY 2006 |
|---|---|---|---|---|---|---|
| Budget Balance | -$83.6B | $-164.4B | $48.3B (12/07) |
-$454.8B | -$161.5B | -$248.2B |
| Net Revenues | $237.8B | $144.8B | -14.1% | -1.7% | 6.7% | 11.8% |
| Net Outlays | $321.4B | $309.2B | 40.5% | 9.1% | 2.8% | 7.4% |

Tom Moeller
AuthorMore in Author Profile »Prior to joining Haver Analytics in 2000, Mr. Moeller worked as the Economist at Chancellor Capital Management from 1985 to 1999. There, he developed comprehensive economic forecasts and interpreted economic data for equity and fixed income portfolio managers. Also at Chancellor, Mr. Moeller worked as an equity analyst and was responsible for researching and rating companies in the economically sensitive automobile and housing industries for investment in Chancellor’s equity portfolio. Prior to joining Chancellor, Mr. Moeller was an Economist at Citibank from 1979 to 1984. He also analyzed pricing behavior in the metals industry for the Council on Wage and Price Stability in Washington, D.C. In 1999, Mr. Moeller received the award for most accurate forecast from the Forecasters' Club of New York. From 1990 to 1992 he was President of the New York Association for Business Economists. Mr. Moeller earned an M.B.A. in Finance from Fordham University, where he graduated in 1987. He holds a Bachelor of Arts in Economics from George Washington University.
More Economy in Brief


