 Global| Jun 05 2019
U.S. ADP Private-Sector Payroll Gains Nearly Evaporate
by:Tom Moeller
|in:Economy in Brief
Summary
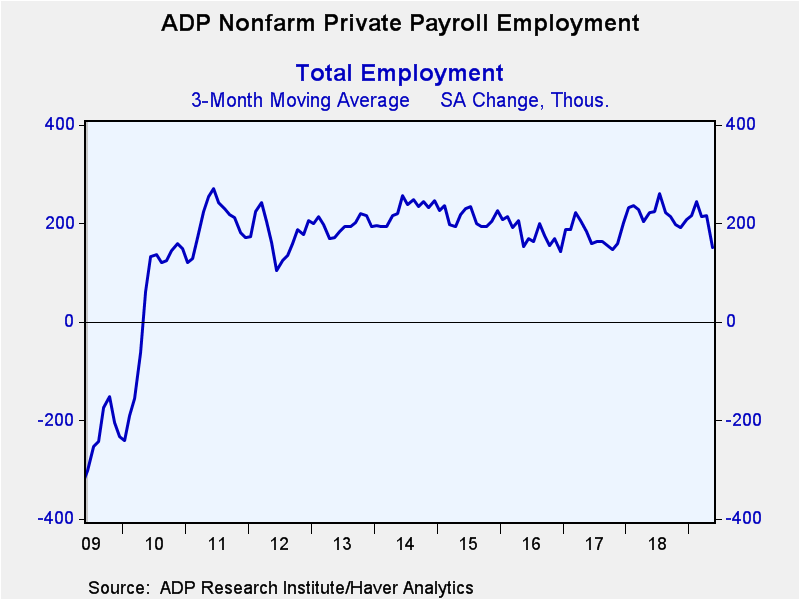
ADP indicated in its National Employment Report that private nonfarm payrolls during May edged 27,000 higher (1.9% y/y) following 271,000 April rise, revised from 275,000. The March increase was revised to 158,000 from 151,000. The [...]
ADP indicated in its National Employment Report that private nonfarm payrolls during May edged 27,000 higher (1.9% y/y) following 271,000 April rise, revised from 275,000. The March increase was revised to 158,000 from 151,000. The May increase was the smallest increase since March 2010 when the job market was contracting. A 178,000 gain had been expected in the Action Economics Forecast Survey. The three-month average rise in private-sector payrolls fell to 152,000, its lowest since October 2017. During the last ten years, there has been an 83% correlation between the change in the ADP figure and the change in nonfarm private-sector payrolls as measured by the Bureau of Labor Statistics.
The ADP National Employment Report is calculated from ADP's business payroll transaction system covering 411,000 companies and nearly 24 million employees. The data is calibrated and aligned with the Bureau of Labor Statistics establishment survey data and is produced by the Automatic Data Processing Research Institute in collaboration Moody's Analytics Inc. The ADP data only cover private sector employment.
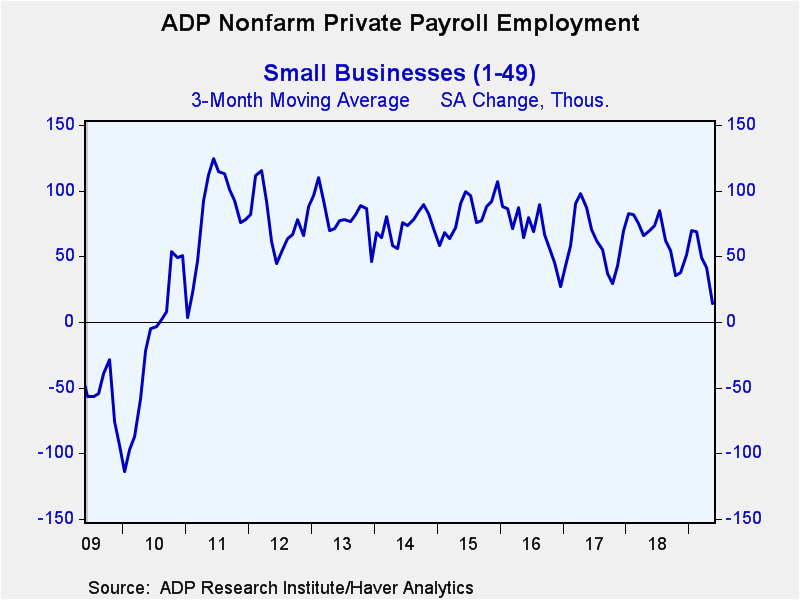
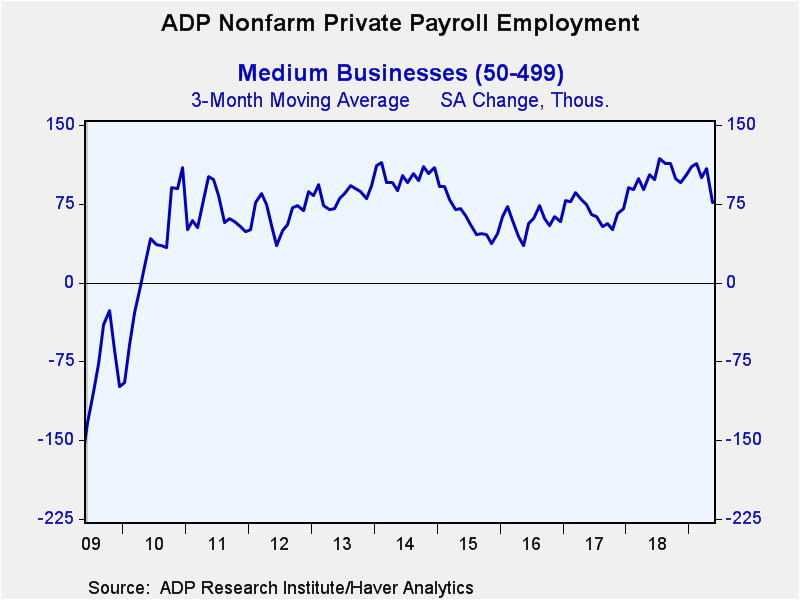
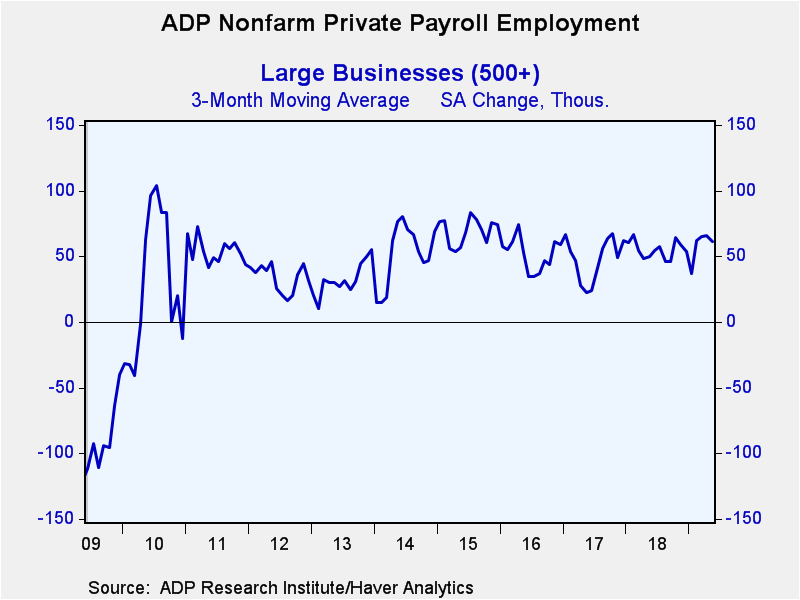
Small business hiring declined 52,000 (+1.1% y/y) after a 71,000 increase. The three-month average gain of 14,000 was down from 70,000 in January and the smallest since January 2011. Medium-sized payrolls rose a diminished 11,000 (2.6% y/y) and by a weakened 77,000 on a three-month basis. Large payrolls firmed 68,000 m/m (2.4% y/y) and by a steady 61,000 during the last three months.
Goods-producing employment weakened 43,000 (+1.9% y/y) in May after a 48,000 rise. The three-month average increase fell to 4,000, down from a 73,000 high in March 2018. Construction sector payrolls fell 36,000 (+3.3% y/y) and reversed April's 45,000 rise. The three-month average change collapsed to 5,000 from 39,000 in February. Manufacturing sector employment declined 3,000 (+1.2% y/y). The three-month average rise eased to zero, its weakest performance since a decline in December 2016. Natural resource and mining sector payrolls declined 4,000. Year-to-year growth fell to 1.6% from a 9.2% high last June.
Private service-sector payrolls improved 71,000 (1.9% y/y) in May after a 223,000 surge. Three-month average growth of 148,000 was below the 185,000 average as of April. Trade transportation & utilities employment held steady (1.1% y/y) with three-month of 8,000 down from the 39,000 high as of September. Professional and business services payrolls increased a weakened 22,000 (2.7% y/y) and jobs in education & health services rose a lessened 33,000 (2.3% y/y). Three-month average growth was a steady 51,000. Leisure & hospitality employment rose 16,000 (2.6% y/y), down from a 53,000 April gain. Employment in the financial services sector rose an improved 13,000 (1.3% y/y). The three-month average gain was steady at 8,000. Information sector employment slipped 1,000 (+0.4% y/y), but three-month growth remained improved at 3,000.
The ADP National Employment Report data can be found in Haver's USECON database; historical figures date back to April 2001 for the total and industry breakdown, and back to January 2005 for the business size breakout. The expectation figure is available in Haver's AS1REPNA database.
| ADP/Moody's National Employment Report | May | Apr | Mar | May Y/Y | 2018 | 2017 | 2016 |
|---|---|---|---|---|---|---|---|
| Nonfarm Private Payroll Employment (m/m chg, 000s) | 27 | 271 | 158 | 1.9% | 2.0% | 1.7% | 2.0% |
| Small Payroll (1-49) | -52 | 71 | 24 | 1.1 | 1.5 | 1.5 | 1.9 |
| Medium Payroll (50-499) | 11 | 145 | 74 | 2.6 | 2.3 | 1.8 | 1.5 |
| Large Payroll (>500) | 68 | 55 | 60 | 2.4 | 2.3 | 2.1 | 2.7 |
| Goods-Producing | -43 | 48 | 7 | 1.9 | 3.1 | 1.7 | 0.8 |
| Construction | -36 | 45 | 7 | 3.3 | 5.0 | 3.3 | 4.3 |
| Manufacturing | -3 | 6 | -2 | 1.2 | 1.8 | 0.8 | 0.1 |
| Service-Producing | 71 | 223 | 151 | 1.9 | 1.7 | 1.8 | 2.2 |
Tom Moeller
AuthorMore in Author Profile »Prior to joining Haver Analytics in 2000, Mr. Moeller worked as the Economist at Chancellor Capital Management from 1985 to 1999. There, he developed comprehensive economic forecasts and interpreted economic data for equity and fixed income portfolio managers. Also at Chancellor, Mr. Moeller worked as an equity analyst and was responsible for researching and rating companies in the economically sensitive automobile and housing industries for investment in Chancellor’s equity portfolio. Prior to joining Chancellor, Mr. Moeller was an Economist at Citibank from 1979 to 1984. He also analyzed pricing behavior in the metals industry for the Council on Wage and Price Stability in Washington, D.C. In 1999, Mr. Moeller received the award for most accurate forecast from the Forecasters' Club of New York. From 1990 to 1992 he was President of the New York Association for Business Economists. Mr. Moeller earned an M.B.A. in Finance from Fordham University, where he graduated in 1987. He holds a Bachelor of Arts in Economics from George Washington University.
More Economy in Brief
 Global| Feb 05 2026
Charts of the Week: Balanced Policy, Resilient Data and AI Narratives
by:Andrew Cates


