 Global| Oct 07 2010
Though Weekly Initial Claims For Jobless Insurance Slip, Other Signs of Job Market Improvement Are Few
by:Tom Moeller
|in:Economy in Brief
Summary
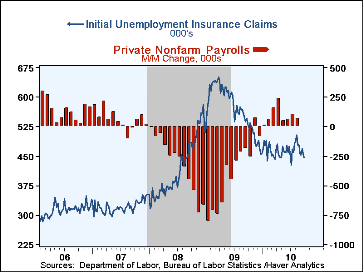
Today came the indication that initial claims for unemployment insurance fell 11,000 to 445,000 in early October and reversed most of the prior week's gain. The latest was the lowest since the second week of July and the 4-week moving [...]
 Today came the indication that initial claims for unemployment insurance
fell 11,000 to 445,000 in early October and reversed most of the prior
week's gain. The latest was the lowest since the second week of July and the 4-week moving average fell slightly
as well to 455,750. The latest figure also was below Consensus forecasts for a decline to
445,000.During the last ten years there has been a 78% correlation between the level
of initial unemployment insurance claims and the m/m change in payroll
employment.
So has the job market resumed its earlier improvement? All-in-all, recent numbers hardly make a convincing case that it has. Yesterday, payroll processor Automatic Data Processing (ADP) indicated that private sector employment fell in September. That added to the Challenger report of a decline in September payrolls. These indications followed ISM reports of a weak September job market, notably in the factory sector. Together, these reports bolstered the widespread expectation that September payrolls, to be released tomorrow, rose an insignificant 5,000 according to Action Economics' Consensus. It forecasts a collection of major economic indicators which are contained in Haver's AS1REPNA database.
Moreover, other leading economic indicators like building permits, consumer expectations and factory sector orders suggest mere stability in the economy's growth rate. Measured improvement in the recovery's growth seems to await some working out of the larger roadblocks to robust growth such as an end to the housing sector's travails and an end the individuals' quest to rebuild balance sheets.
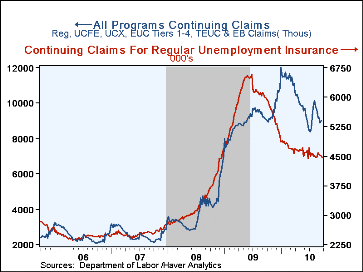
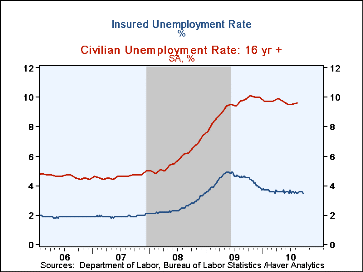
Looking more closely at the weekly data, a 48,000 w/w decline to 4.462 million in continuing claims for state-administered programs brought them to the low end of a range in place since late May. The associated unemployment rate slipped to 3.5% and also continued its sideways movement. These claimants are, however, only about half of the total number of people currently receiving unemployment insurance. Regular extended benefits, with eligibility dependent on conditions in individual states, jumped to 1.012M on September 18, the latest available figure and near the series' high. In July, the Congress renewed the special Emergency Unemployment Compensation program referred to as EUC 2008. By September 18, also the latest available for this program, it had 4.124 million beneficiaries. It will now accept claims through November 30 and will be continuing to pay out benefits until April 30, 2011.
Haver Analytics calculates a grand total of all claimants for unemployment insurance. This series includes extended and emergency programs as well as selective programs for railway employees, recently discharged veterans and federal employees. All together, on September 18th, the total number of recipients was 9.021 million, off 1.0% y/y and down from the early-January high of 11.989 million. These data are not seasonally adjusted.
Data on weekly unemployment insurance programs are contained in Haver's WEEKLY database and summarized monthly in USECON. Data for individual states, including the unemployment rates that determine individual state eligibility for the extended benefits programs and specific "tiers" of the emergency program, are in REGIONW, a database of weekly data for states and various regional divisions.
| Unemployment Insurance (000s) | 10/02/10 | 09/25/10 | 09/18/10 | Y/Y | 2009 | 2008 | 2007 |
|---|---|---|---|---|---|---|---|
| Initial Claims | 445 | 456 | 469 | -16.2% | 572 | 419 | 321 |
| Continuing Claims | -- | 4,462 | 4,510 | -25.5 | 5,809 | 3,340 | 2,549 |
| Insured Unemployment Rate(%) | -- | 3.5 | 3.6 | 4.6 (09/09) |
4.4 | 2.5 | 1.9 |
| Total Continuing Claims* (NSA) | -- | -- | 9.021M | -1.0% | 9.085M | 3.884M | 2.584M |
* Calculated by Haver Analytics, as the sum of regular state programs, extended benefits, federal employees, veterans, railroad retirement board and "EUC" 2008.
Tom Moeller
AuthorMore in Author Profile »Prior to joining Haver Analytics in 2000, Mr. Moeller worked as the Economist at Chancellor Capital Management from 1985 to 1999. There, he developed comprehensive economic forecasts and interpreted economic data for equity and fixed income portfolio managers. Also at Chancellor, Mr. Moeller worked as an equity analyst and was responsible for researching and rating companies in the economically sensitive automobile and housing industries for investment in Chancellor’s equity portfolio. Prior to joining Chancellor, Mr. Moeller was an Economist at Citibank from 1979 to 1984. He also analyzed pricing behavior in the metals industry for the Council on Wage and Price Stability in Washington, D.C. In 1999, Mr. Moeller received the award for most accurate forecast from the Forecasters' Club of New York. From 1990 to 1992 he was President of the New York Association for Business Economists. Mr. Moeller earned an M.B.A. in Finance from Fordham University, where he graduated in 1987. He holds a Bachelor of Arts in Economics from George Washington University.
More Economy in Brief
 Global| Feb 05 2026
Charts of the Week: Balanced Policy, Resilient Data and AI Narratives
by:Andrew Cates


