 Global| Aug 16 2004
The Netherlands' Second Quarter Decline in GDP - A Result of Statistical Errors?
Summary
Of the euro zone countries that have reported second quarter Gross Domestic Product results, the Netherlands is the only one to date, to show a decline. In percentage terms the decline was -0.20% and, in euros, 191 million. Looking at [...]
Of the euro zone countries that have reported second quarter Gross Domestic Product results, the Netherlands is the only one to date, to show a decline. In percentage terms the decline was -0.20% and, in euros, 191 million.
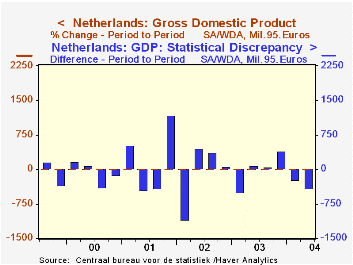
Looking at the details, one finds that consumption was up slightly and net exports were up substantially. Together they rose by 751 million euros. The rise was offset in part by a decline of 536 million euros in gross capital formation, made up of a 544 million euro decline in fixed capital formation and a rise of 8 million euros in inventory accumulation. A shift in the statistical discrepancy from a positive 82 million euros to a negative 324 million euros more than offset the remaining positive influence of consumption and net exports. The change in the discrepancy was 406 million euros compared to the change in the total of 191 million euros.
These details are perhaps a good reminder of the probabilistic nature of the national accounts data. A 0.20% decline in GDP is probably not significantly different from a rise of the same magnitude.
| The Netherlands GDP | Q2 04 | Q1 04 | Change |
|---|---|---|---|
| (Millions 1995 Euros) | |||
| Consumption | 68258 | 68184 | 74 |
| Gross Fixed Capital Formation | 18425 | 18969 | -544 |
| Inventory Change | 31 | 23 | 8 |
| Net Exports | 6039 | 5362 | 677 |
| Exports | 67148 | 64188 | 2960 |
| Import | -61109 | -58826 | 2283 |
| Statistical Discrepancy | -324 | 82 | -406 |
| Gross Domestic Product | 92429 | 92620 | -191 |
More Economy in Brief


