 Global| Apr 26 2010
The Components Of The 30% Y/Y Growth In Singapore's Manufacturing Production In Q 1
Summary
Almost two weeks ago, the Department of Statistics in Singapore released its flash estimate of first quarter year over the year growth of the economy of the city state--13.1%. The year to year growth in the manufacturing sector was [...]

Almost two weeks ago, the Department of Statistics in Singapore released its flash estimate of first quarter year over the year growth of the economy of the city state--13.1%. The year to year growth in the manufacturing sector was estimated at 30.0%, as shown in the first chart.
Today March data for industrial production and five industry clusters--Electronics, Chemicals, Biomedicals, Precision Engineering and Transport were released. We have aggregated the monthly data to quarterly data for comparison with the GDP data. The year to year increases in Industrial Production are very close to those for Manufacturing in the GNP data, as can be seen in the table below.
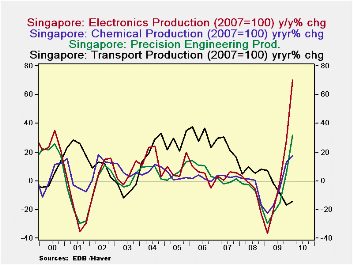
The 30.0% year to year change in the quarterly GNP data for manufacturing in the first quarter of 2010 was due to a 70.3% year to year increase in the production of Electronics, a 37.2% increase in the production of Biomedicals, a 32.0% increase in the production of Precision Engineering products and a 17.3% increase in the production of Chemicals. The production of Transport equipment actually declined 14.2% in the first quarter. The year to year percent changes in the quarterly data for the production of Electronics, Chemicals, Precision Engineering and Transport clusters are shown in the second chart. The year to year changes in the production of Biomedicals is shown in a separate, the third, chart. The pattern of production in all five has been erratic but most notably in that of Biomedicals.

| Singapore: Year to Year % Change | Q1 10 | Q4 09 | Q3 09 | Q2 09 | Q1 09 | Q4 08 | Q3 08 | Q2 08 | Q1 08 |
|---|---|---|---|---|---|---|---|---|---|
| Gross Domestic Product | 13.1 | 4.0 | 0.6 | -3.1 | -9.4 | -4.2 | 0.0 | 2.5 | 6.7 |
| Manufacturing | 30.0 | 2.2 | 2.6 | -0.4 | -23.8 | -10.7 | -11.0 | -5.6 | 12.6 |
| Industrial Production (2007=100)y/y% | 32.9 | 2.5 | 7.5 | -0.6 | -23.8 | -10.7 | -10.9 | -5.6 | 12.2 |
| Electronics | 70.3 | 28.0 | -1.2 | -19.4 | -36.6 | -23.2 | -5.4 | -0.9 | 3.5 |
| Chemicals | 17.3 | 12.9 | -5.3 | -16.5 | -22.6 | -16.9 | -0.1 | 1.0 | 1.6 |
| Biomedicals | 37.2 | -24.2 | 64.3 | 64.9 | -23.5 | 1.46 | -35.8 | -28.1 | 49.8 |
| Precision Engineering | 32.0 | 5.5 | -15.8 | -22.0 | -29.1 | -15.5 | -7.1 | -2.7 | -2.0 |
| Transport | -14.2 | -16.7 | -8.6 | -2.0 | 7.2 | 8.2 | 5.4 | 9.9 | 4.7 |
More Economy in Brief


