 Global| Mar 29 2016
Texas Factory Sector Deterioration Eases
by:Tom Moeller
|in:Economy in Brief
Summary
The Federal Reserve Bank of Dallas indicated that industrial activity in the state continued to deteriorate this month, but the rate of decline lessened. The measure of general business activity of -13.6 was the smallest negative [...]
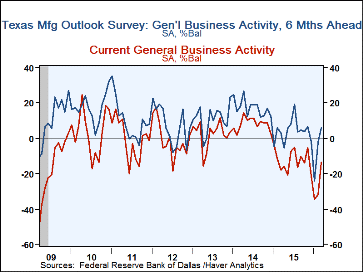
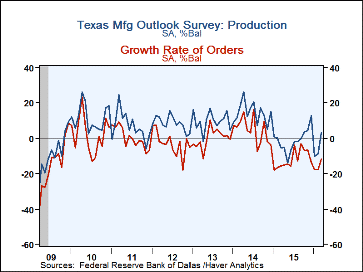
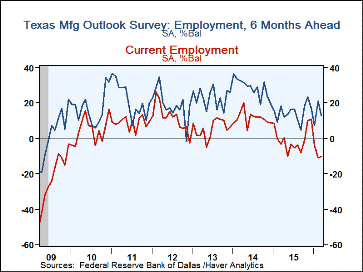
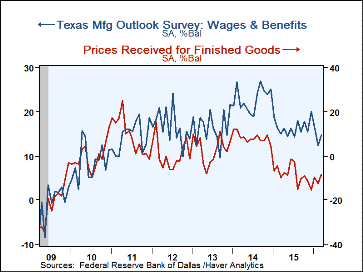
The Federal Reserve Bank of Dallas indicated that industrial activity in the state continued to deteriorate this month, but the rate of decline lessened. The measure of general business activity of -13.6 was the smallest negative reading since November. The figure gained m/m as production & shipments turned positive. Declines in new orders, employment and wages & benefits growth eased. The rate of decline in finished goods prices slowed.
Expectations for business activity in six months also improved. The expected business activity reading turned positive, although the expected readings for shipments and production deteriorated. On the labor front, expectations for employment deteriorated, but wages & benefits improved. Worker-hours backpedaled to a three year low.
Each index is calculated by subtracting the percentage reporting a decrease from the percentage reporting an increase. When all firms report that activity has increased, an index will register 100. An index will register -100 when all firms report a decrease. An index will be zero when the number of firms reporting an increase or decrease is equal. Items may not add up to 100% because of rounding. Data for the Texas Manufacturing Outlook can be found in Haver's SURVEYS database.
| Texas Manufacturing Outlook Survey (SA, % Balance) | Mar | Feb | Jan | Mar'15 | 2015 | 2014 | 2013 |
|---|---|---|---|---|---|---|---|
| Current General Business Activity Index | -13.6 | -31.8 | -34.6 | -17.7 | -12.5 | 8.3 | 2.2 |
| Production | 3.3 | -8.5 | -10.2 | -5.4 | -1.0 | 14.5 | 9.8 |
| Growth Rate of Orders | -11.7 | -17.4 | -17.5 | -15.4 | -11.8 | 4.7 | 0.1 |
| Number of Employees | -10.3 | -11.1 | -4.2 | -3.2 | -0.4 | 11.5 | 5.6 |
| Prices Received for Finished Goods | -8.2 | -12.5 | -9.6 | -9.9 | -8.5 | 8.3 | 2.9 |
| General Business Activity Index Expected in Six Months | 6.1 | -2.1 | -24.0 | 3.3 | 4.1 | 17.4 | 11.0 |
| Production | 31.8 | 33.4 | 26.5 | 36.2 | 31.1 | 42.7 | 37.1 |
| Growth Rate of New Orders | 17.4 | 18.7 | 16.8 | 12.9 | 20.7 | 31.5 | 25.0 |
| Wages & Benefits | 34.7 | 34.5 | 28.5 | 34.2 | 33.2 | 43.1 | 38.2 |
Tom Moeller
AuthorMore in Author Profile »Prior to joining Haver Analytics in 2000, Mr. Moeller worked as the Economist at Chancellor Capital Management from 1985 to 1999. There, he developed comprehensive economic forecasts and interpreted economic data for equity and fixed income portfolio managers. Also at Chancellor, Mr. Moeller worked as an equity analyst and was responsible for researching and rating companies in the economically sensitive automobile and housing industries for investment in Chancellor’s equity portfolio. Prior to joining Chancellor, Mr. Moeller was an Economist at Citibank from 1979 to 1984. He also analyzed pricing behavior in the metals industry for the Council on Wage and Price Stability in Washington, D.C. In 1999, Mr. Moeller received the award for most accurate forecast from the Forecasters' Club of New York. From 1990 to 1992 he was President of the New York Association for Business Economists. Mr. Moeller earned an M.B.A. in Finance from Fordham University, where he graduated in 1987. He holds a Bachelor of Arts in Economics from George Washington University.
More Economy in Brief
 Global| Feb 05 2026
Charts of the Week: Balanced Policy, Resilient Data and AI Narratives
by:Andrew Cates


