 Global| Nov 10 2003
Taiwanese Merchandise Trade: Shifting Trade Patterns
Summary
Although total merchandise exports and imports in Taiwan declined in the month of October, the trend toward increased trade with Asia and declining trade with North America continues. In October, exports to Asia were up 18.9% from a [...]
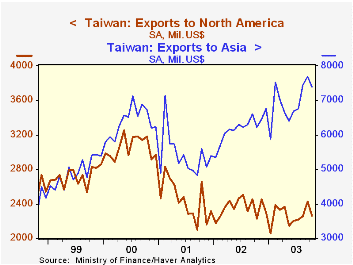
Although total merchandise exports and imports in Taiwan declined in the month of October, the trend toward increased trade with Asia and declining trade with North America continues. In October, exports to Asia were up 18.9% from a year ago, while exports to North America were up only 1.7%.
Similarly, imports from Asia were 15.1% greater in October of this year compared with October 2002, while imports from North America were 3.3% over the same period.
On the basis of the data for the year to date, Taiwan's surplus on trade with North America is still averaging about $10 billion a year as the decline in exports has been matched by a decline in imports. However, Taiwan's trade balance with Asia, which was in deficit to the amount of $1.8 billion in 2000, is currently averaging a surplus of about $12 billion.
| Billions of US$ | Oct 2003 | Sep 2003 | Oct 2002 | M/M % |
Y/Y % |
2002 | 2001 | 2000 |
|---|---|---|---|---|---|---|---|---|
| Total Trade | ||||||||
| Exports | 12372.6 | 12893.7 | 10834.5 | -4.04 | 14.20 | 130456.5 | 123426.0 | 148226.0 |
| Imports | 9800.7 | 11131.3 | 9181.1 | -11.95 | 6.75 | 112230.1 | 107738.8 | 139875.4 |
| Balance | 2571.9 | 1762.4 | 1653.4 | 45.93 | 55.55 | 18226.4 | 15687.2 | 8350.6 |
| Trade with Asia | ||||||||
| Exports | 7382.7 | 7697.2 | 6209.3 | -4.09 | 18.89 | 74216.8 | 64921.4 | 79582.5 |
| Imports | 6142.0 | 6424.2 | 533.6 | -4.39 | 15.10 | 63887.6 | 58818.3 | 78385.3 |
| Balance | 1240.8 | 1273.1 | 873.0 | -2.54 | 42.12 | 10329.2 | 6103.2 | -1802.8 |
| Trade with N. A. | ||||||||
| Exports | 2262.1 | 2432.8 | 2225.4 | -4.02 | 1.65 | 28278.4 | 29319.1 | 36669.9 |
| Imports | 1468.3 | 1617.8 | 1352.0 | -9.24 | 8.60 | 19078.7 | 19258.0 | 26310.6 |
| Balance | 793.8 | 815 | 873.4 | -2.60 | -9.11 | 9199.7 | 10061.1 | 10359.3 |
More Economy in Brief


